

204
6 Charge and Energy Transfer Processes
Again, all the contributions contain products of orbitals belonging to X and Y, so
the interaction is short range. This means that in both cases, when X and Y are not
close to each other or connected by conducting bridges, the coupling between the
two diabatic states is very small.
In all the electron transfer processes occurring in condensed phase the static
effect of the environment is of paramount importance, because the different charge
distributions of ground-state reactants, excited and transition states, and products,
entail different interactions with the environment. Marcus’ theory of thermal CT
reactions highlights such effects [21]. For each of the two centers X and Y we focus
on a coordinate that affects its interaction with the environment, say R X and R Y ,
respectively. It is particularly easy to identify such coordinates for metal complexes,
as the breathing coordinates of the first ligand or solvent shells. For instance, in a
complex with only one kind of ligands, often all the ligands are placed at the same
distance, R X or R Y , from the metal center. If, instead, the distances of the ligands are
different, we can take as R X (or R Y ) an average distance. Normally, as the charge
of the metal increases, the equilibrium distance of the ligands decreases. So, if X
n+
is the donor and Y
m+ the acceptor, the electron transfer will cause a decrease of the
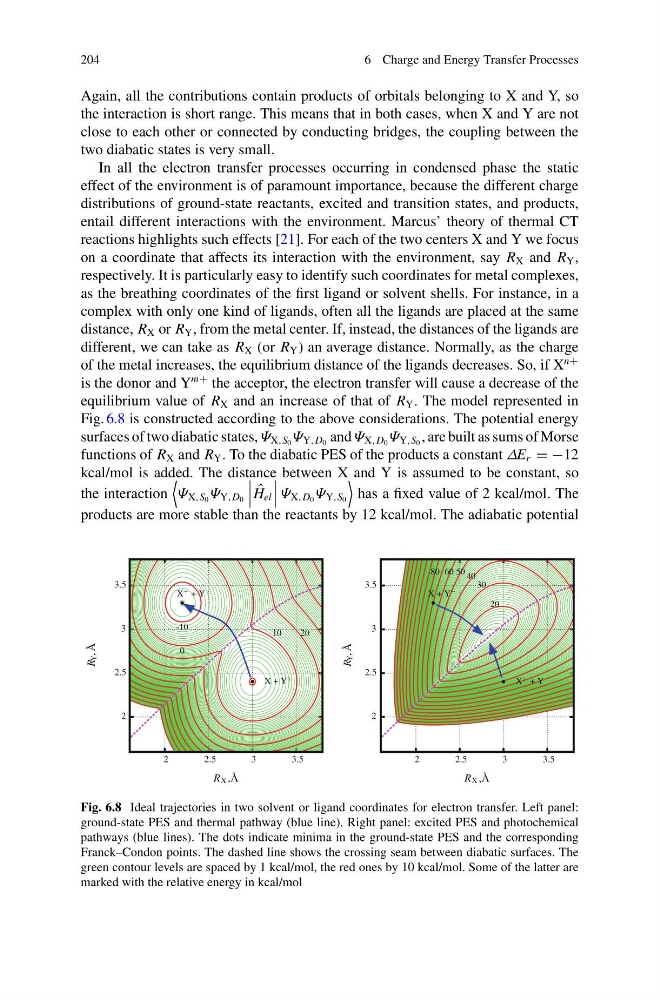
equilibrium value of R X and an increase of that of R Y . The model represented in
Fig. 6.8 is constructed according to the above considerations. The potential energy
surfaces of two diabatic states, Ψ X,S 0 Ψ Y,D 0 and Ψ X,D 0 Ψ Y,S 0 , are built as sums of Morse
functions of R X and R Y . To the diabatic PES of the products a constant ΔE r = −12
kcal/mol is added. The distance between X and Y is assumed to be constant, so
the interaction
Ψ X,S 0 Ψ Y,D 0
ˆ
H el
Ψ X,D 0 Ψ Y,S 0
has a fixed value of 2 kcal/mol. The
products are more stable than the reactants by 12 kcal/mol. The adiabatic potential
1
0
2
0
0
-10
X
+ + Y
X + Y
+
•
•
RX , ˚
A
RY, ˚
A
3.5
3
2.5
2
3.5
3
2.5
2
80 60 50 40
30
20
X
+ + Y
X + Y
+
•
•
RX , ˚
A
RY, ˚
A
3.5
3
2.5
2
3.5
3
2.5
2
Fig. 6.8 Ideal trajectories in two solvent or ligand coordinates for electron transfer. Left panel:
ground-state PES and thermal pathway (blue line). Right panel: excited PES and photochemical
pathways (blue lines). The dots indicate minima in the ground-state PES and the corresponding
Franck–Condon points. The dashed line shows the crossing seam between diabatic surfaces. The
green contour levels are spaced by 1 kcal/mol, the red ones by 10 kcal/mol. Some of the latter are
marked with the relative energy in kcal/mol
6 Charge and Energy Transfer Processes
Again, all the contributions contain products of orbitals belonging to X and Y, so
the interaction is short range. This means that in both cases, when X and Y are not
close to each other or connected by conducting bridges, the coupling between the
two diabatic states is very small.
In all the electron transfer processes occurring in condensed phase the static
effect of the environment is of paramount importance, because the different charge
distributions of ground-state reactants, excited and transition states, and products,
entail different interactions with the environment. Marcus’ theory of thermal CT
reactions highlights such effects [21]. For each of the two centers X and Y we focus
on a coordinate that affects its interaction with the environment, say R X and R Y ,
respectively. It is particularly easy to identify such coordinates for metal complexes,
as the breathing coordinates of the first ligand or solvent shells. For instance, in a
complex with only one kind of ligands, often all the ligands are placed at the same
distance, R X or R Y , from the metal center. If, instead, the distances of the ligands are
different, we can take as R X (or R Y ) an average distance. Normally, as the charge
of the metal increases, the equilibrium distance of the ligands decreases. So, if X
n+
is the donor and Y
m+ the acceptor, the electron transfer will cause a decrease of the
equilibrium value of R X and an increase of that of R Y . The model represented in
Fig. 6.8 is constructed according to the above considerations. The potential energy
surfaces of two diabatic states, Ψ X,S 0 Ψ Y,D 0 and Ψ X,D 0 Ψ Y,S 0 , are built as sums of Morse
functions of R X and R Y . To the diabatic PES of the products a constant ΔE r = −12
kcal/mol is added. The distance between X and Y is assumed to be constant, so
the interaction
Ψ X,S 0 Ψ Y,D 0
ˆ
H el
Ψ X,D 0 Ψ Y,S 0
has a fixed value of 2 kcal/mol. The
products are more stable than the reactants by 12 kcal/mol. The adiabatic potential
1
0
2
0
0
-10
X
+ + Y
X + Y
+
•
•
RX , ˚
A
RY, ˚
A
3.5
3
2.5
2
3.5
3
2.5
2
80 60 50 40
30
20
X
+ + Y
X + Y
+
•
•
RX , ˚
A
RY, ˚
A
3.5
3
2.5
2
3.5
3
2.5
2
Fig. 6.8 Ideal trajectories in two solvent or ligand coordinates for electron transfer. Left panel:
ground-state PES and thermal pathway (blue line). Right panel: excited PES and photochemical
pathways (blue lines). The dots indicate minima in the ground-state PES and the corresponding
Franck–Condon points. The dashed line shows the crossing seam between diabatic surfaces. The
green contour levels are spaced by 1 kcal/mol, the red ones by 10 kcal/mol. Some of the latter are
marked with the relative energy in kcal/mol