

6.5 Charge or Electron Transfer
205
T v
E
∗
| E r |
X
∗ +Y
X
+ +Y
X
+ +Y
X+Y
+
X+Y
+
increasing R X , decreasing R Y
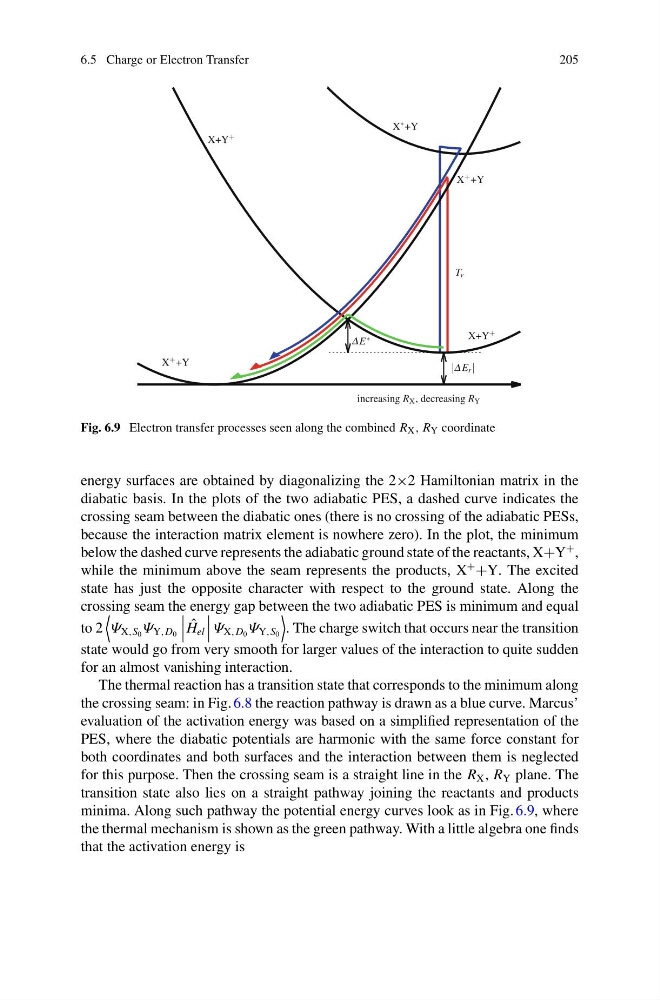
Fig. 6.9 Electron transfer processes seen along the combined R X , R Y coordinate
energy surfaces are obtained by diagonalizing the 2×2 Hamiltonian matrix in the
diabatic basis. In the plots of the two adiabatic PES, a dashed curve indicates the
crossing seam between the diabatic ones (there is no crossing of the adiabatic PESs,
because the interaction matrix element is nowhere zero). In the plot, the minimum
below the dashed curve represents the adiabatic ground state of the reactants, X+Y
+ ,
while the minimum above the seam represents the products, X
+
+Y. The excited
state has just the opposite character with respect to the ground state. Along the
crossing seam the energy gap between the two adiabatic PES is minimum and equal
to 2
Ψ X,S 0 Ψ Y,D 0
ˆ
H el
Ψ X,D 0 Ψ Y,S 0
. The charge switch that occurs near the transition
state would go from very smooth for larger values of the interaction to quite sudden
for an almost vanishing interaction.
The thermal reaction has a transition state that corresponds to the minimum along
the crossing seam: in Fig. 6.8 the reaction pathway is drawn as a blue curve. Marcus’
evaluation of the activation energy was based on a simplified representation of the
PES, where the diabatic potentials are harmonic with the same force constant for
both coordinates and both surfaces and the interaction between them is neglected
for this purpose. Then the crossing seam is a straight line in the R X , R Y plane. The
transition state also lies on a straight pathway joining the reactants and products
minima. Along such pathway the potential energy curves look as in Fig. 6.9, where
the thermal mechanism is shown as the green pathway. With a little algebra one finds
that the activation energy is
205
T v
E
∗
| E r |
X
∗ +Y
X
+ +Y
X
+ +Y
X+Y
+
X+Y
+
increasing R X , decreasing R Y
Fig. 6.9 Electron transfer processes seen along the combined R X , R Y coordinate
energy surfaces are obtained by diagonalizing the 2×2 Hamiltonian matrix in the
diabatic basis. In the plots of the two adiabatic PES, a dashed curve indicates the
crossing seam between the diabatic ones (there is no crossing of the adiabatic PESs,
because the interaction matrix element is nowhere zero). In the plot, the minimum
below the dashed curve represents the adiabatic ground state of the reactants, X+Y
+ ,
while the minimum above the seam represents the products, X
+
+Y. The excited
state has just the opposite character with respect to the ground state. Along the
crossing seam the energy gap between the two adiabatic PES is minimum and equal
to 2
Ψ X,S 0 Ψ Y,D 0
ˆ
H el
Ψ X,D 0 Ψ Y,S 0
. The charge switch that occurs near the transition
state would go from very smooth for larger values of the interaction to quite sudden
for an almost vanishing interaction.
The thermal reaction has a transition state that corresponds to the minimum along
the crossing seam: in Fig. 6.8 the reaction pathway is drawn as a blue curve. Marcus’
evaluation of the activation energy was based on a simplified representation of the
PES, where the diabatic potentials are harmonic with the same force constant for
both coordinates and both surfaces and the interaction between them is neglected
for this purpose. Then the crossing seam is a straight line in the R X , R Y plane. The
transition state also lies on a straight pathway joining the reactants and products
minima. Along such pathway the potential energy curves look as in Fig. 6.9, where
the thermal mechanism is shown as the green pathway. With a little algebra one finds
that the activation energy is