

4.2 Vibrational Wavepacket Dynamics
125
τ = 250 fs
τ = 60 fs
τ = 10 fs
time, ps
R
10
8
6
4
2
0
8.5
8
7.5
7
6.5
6
5.5
5
4.5
4
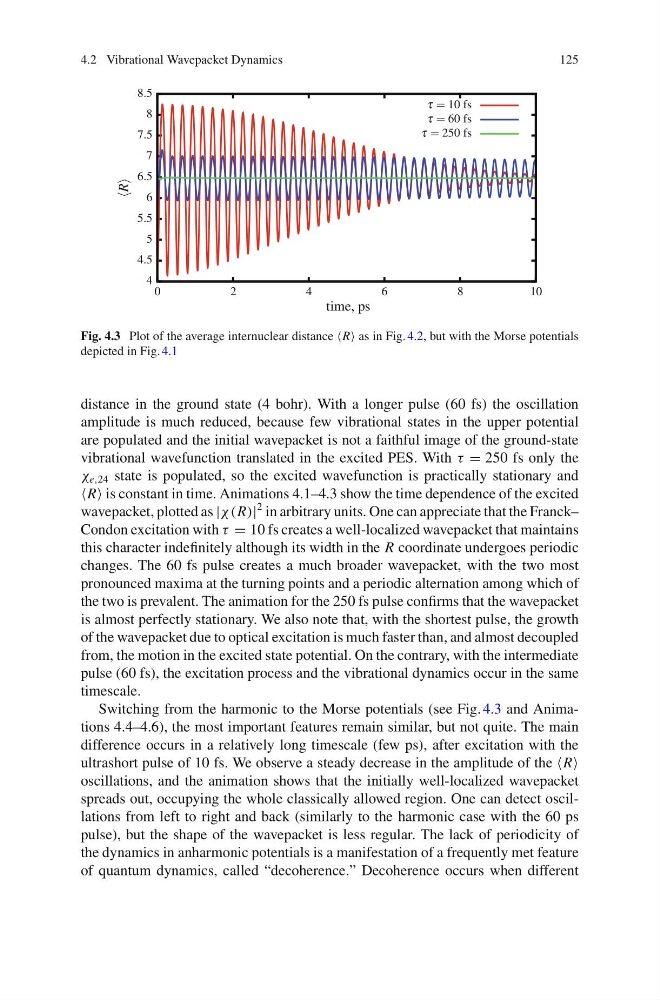
Fig. 4.3 Plot of the average internuclear distance R as in Fig. 4.2, but with the Morse potentials
depicted in Fig. 4.1
distance in the ground state (4 bohr). With a longer pulse (60 fs) the oscillation
amplitude is much reduced, because few vibrational states in the upper potential
are populated and the initial wavepacket is not a faithful image of the ground-state
vibrational wavefunction translated in the excited PES. With τ = 250 fs only the
χ e,24 state is populated, so the excited wavefunction is practically stationary and
R is constant in time. Animations 4.1–4.3 show the time dependence of the excited
wavepacket, plotted as |χ(R)|
2 in arbitrary units. One can appreciate that the Franck–
Condon excitation with τ = 10 fs creates a well-localized wavepacket that maintains
this character indefinitely although its width in the R coordinate undergoes periodic
changes. The 60 fs pulse creates a much broader wavepacket, with the two most
pronounced maxima at the turning points and a periodic alternation among which of
the two is prevalent. The animation for the 250 fs pulse confirms that the wavepacket
is almost perfectly stationary. We also note that, with the shortest pulse, the growth
of the wavepacket due to optical excitation is much faster than, and almost decoupled
from, the motion in the excited state potential. On the contrary, with the intermediate
pulse (60 fs), the excitation process and the vibrational dynamics occur in the same
timescale.
Switching from the harmonic to the Morse potentials (see Fig. 4.3 and Animations 4.4–4.6), the most important features remain similar, but not quite. The main
difference occurs in a relatively long timescale (few ps), after excitation with the
ultrashort pulse of 10 fs. We observe a steady decrease in the amplitude of the R
oscillations, and the animation shows that the initially well-localized wavepacket
spreads out, occupying the whole classically allowed region. One can detect oscillations from left to right and back (similarly to the harmonic case with the 60 ps
pulse), but the shape of the wavepacket is less regular. The lack of periodicity of
the dynamics in anharmonic potentials is a manifestation of a frequently met feature
of quantum dynamics, called “decoherence.” Decoherence occurs when different
125
τ = 250 fs
τ = 60 fs
τ = 10 fs
time, ps
R
10
8
6
4
2
0
8.5
8
7.5
7
6.5
6
5.5
5
4.5
4
Fig. 4.3 Plot of the average internuclear distance R as in Fig. 4.2, but with the Morse potentials
depicted in Fig. 4.1
distance in the ground state (4 bohr). With a longer pulse (60 fs) the oscillation
amplitude is much reduced, because few vibrational states in the upper potential
are populated and the initial wavepacket is not a faithful image of the ground-state
vibrational wavefunction translated in the excited PES. With τ = 250 fs only the
χ e,24 state is populated, so the excited wavefunction is practically stationary and
R is constant in time. Animations 4.1–4.3 show the time dependence of the excited
wavepacket, plotted as |χ(R)|
2 in arbitrary units. One can appreciate that the Franck–
Condon excitation with τ = 10 fs creates a well-localized wavepacket that maintains
this character indefinitely although its width in the R coordinate undergoes periodic
changes. The 60 fs pulse creates a much broader wavepacket, with the two most
pronounced maxima at the turning points and a periodic alternation among which of
the two is prevalent. The animation for the 250 fs pulse confirms that the wavepacket
is almost perfectly stationary. We also note that, with the shortest pulse, the growth
of the wavepacket due to optical excitation is much faster than, and almost decoupled
from, the motion in the excited state potential. On the contrary, with the intermediate
pulse (60 fs), the excitation process and the vibrational dynamics occur in the same
timescale.
Switching from the harmonic to the Morse potentials (see Fig. 4.3 and Animations 4.4–4.6), the most important features remain similar, but not quite. The main
difference occurs in a relatively long timescale (few ps), after excitation with the
ultrashort pulse of 10 fs. We observe a steady decrease in the amplitude of the R
oscillations, and the animation shows that the initially well-localized wavepacket
spreads out, occupying the whole classically allowed region. One can detect oscillations from left to right and back (similarly to the harmonic case with the 60 ps
pulse), but the shape of the wavepacket is less regular. The lack of periodicity of
the dynamics in anharmonic potentials is a manifestation of a frequently met feature
of quantum dynamics, called “decoherence.” Decoherence occurs when different