

6.8 Production of Plastic Parts for the Automotive Industry
97
Facility 1
L 3
(20)
L 4
(20)
L 1
(20)
L 2
(10)
Facility 2
L 7
(20)
L 8
(20)
L 5
(15)
L 6
(15)
L 9
(10)
Facility 3
L 12
(20)
L 13
(15)
L 10
(10)
L 11
(20)
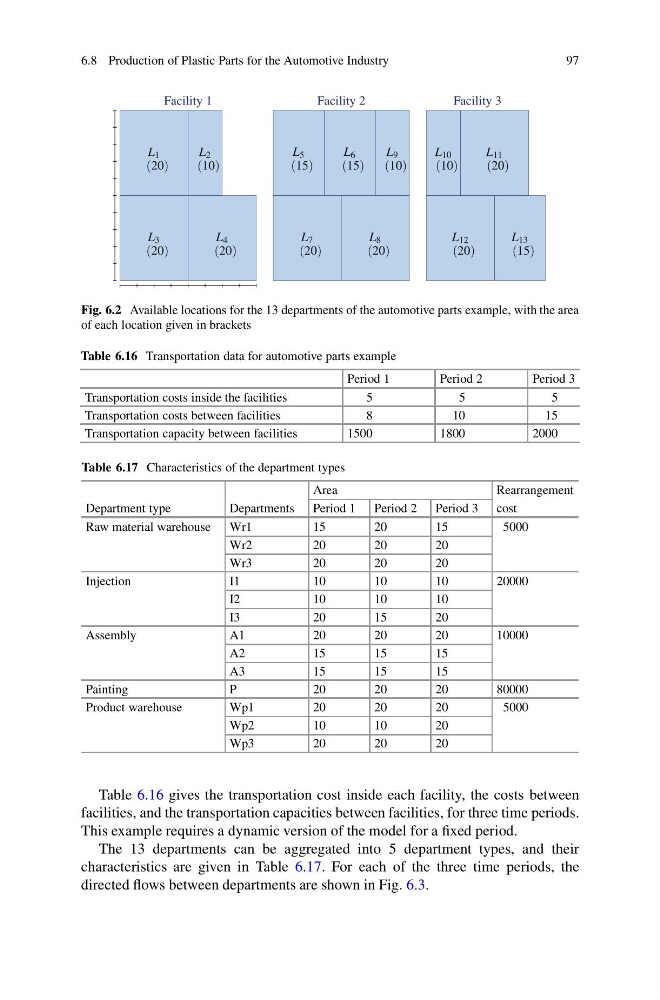
Fig. 6.2 Available locations for the 13 departments of the automotive parts example, with the area
of each location given in brackets
Table 6.16 Transportation data for automotive parts example
Period 1
Period 2
Period 3
Transportation costs inside the facilities
5
5
5
Transportation costs between facilities
8
10
15
Transportation capacity between facilities
1500
1800
2000
Table 6.17 Characteristics of the department types
Area
Rearrangement
Department type
Departments Period 1 Period 2 Period 3 cost
Raw material warehouse Wr1
15
20
15
5000
Wr2
20
20
20
Wr3
20
20
20
Injection
I1
10
10
10
20000
I2
10
10
10
I3
20
15
20
Assembly
A1
20
20
20
10000
A2
15
15
15
A3
15
15
15
Painting
P
20
20
20
80000
Product warehouse
Wp1
20
20
20
5000
Wp2
10
10
20
Wp3
20
20
20
Table 6.16 gives the transportation cost inside each facility, the costs between
facilities, and the transportation capacities between facilities, for three time periods.
This example requires a dynamic version of the model for a fixed period.
The 13 departments can be aggregated into 5 department types, and their
characteristics are given in Table 6.17. For each of the three time periods, the
directed flows between departments are shown in Fig. 6.3.
97
Facility 1
L 3
(20)
L 4
(20)
L 1
(20)
L 2
(10)
Facility 2
L 7
(20)
L 8
(20)
L 5
(15)
L 6
(15)
L 9
(10)
Facility 3
L 12
(20)
L 13
(15)
L 10
(10)
L 11
(20)
Fig. 6.2 Available locations for the 13 departments of the automotive parts example, with the area
of each location given in brackets
Table 6.16 Transportation data for automotive parts example
Period 1
Period 2
Period 3
Transportation costs inside the facilities
5
5
5
Transportation costs between facilities
8
10
15
Transportation capacity between facilities
1500
1800
2000
Table 6.17 Characteristics of the department types
Area
Rearrangement
Department type
Departments Period 1 Period 2 Period 3 cost
Raw material warehouse Wr1
15
20
15
5000
Wr2
20
20
20
Wr3
20
20
20
Injection
I1
10
10
10
20000
I2
10
10
10
I3
20
15
20
Assembly
A1
20
20
20
10000
A2
15
15
15
A3
15
15
15
Painting
P
20
20
20
80000
Product warehouse
Wp1
20
20
20
5000
Wp2
10
10
20
Wp3
20
20
20
Table 6.16 gives the transportation cost inside each facility, the costs between
facilities, and the transportation capacities between facilities, for three time periods.
This example requires a dynamic version of the model for a fixed period.
The 13 departments can be aggregated into 5 department types, and their
characteristics are given in Table 6.17. For each of the three time periods, the
directed flows between departments are shown in Fig. 6.3.