

papers from Pasch and Bru ¨ll, investigations on the graphite porosity influence
on the separation mechanisms by Mekap, and combinations of SGIC with DSC
and FTIR by Cheruthazhekatt.
4.2.2 Thermal Gradient Interaction Chromatography
Solvent gradient HPLC can be successfully replaced by thermal gradient using
reverse phase columns to analyze copolymers, as shown by Chang et al. [120].
At the 3rd International Conference on Polyolefin Characterization in 2010,
Cong et al. [121] showed the possibility of using the Hypercarb column with a
thermal gradient for the analysis of ethylene copolymers [122]. The separation
obtained was similar to the results previously discussed in SGIC but in this case
at isocratic conditions, which allowed the use of a linear IR detector as well as
an in-line viscometer or LS molar mass detection. The separation of a series
of ethylene octene copolymers covering a broad range of comonomer incorporation
is shown in Fig. 33. A linear relation is obtained between elution time and mole
percentage of comonomer incorporation, and elution is independent of molar mass
for molecular weights higher than 20,000 g/mol.
LC volume (mL)
2.5
2
1.5
1
3
4
GPC volume (mL)
4.5
3.5
2.5
3
4
GPC volume (mL)
4.5
3.5
2.5
3
4
GPC volume (mL)
4.5
3.5
2.5
3
4
GPC volume (mL)
4.5
3.5
2.5
0.5
LC volume (mL)
2.5
80
0
8.5%
19.6%
14.8%
2.6%
20
40
60
2
1.5
1
0.5
LC volume (mL)
2.5
2
1.5
1
0.5
LC volume (mL)
2.5
2
1.5
1
0.5
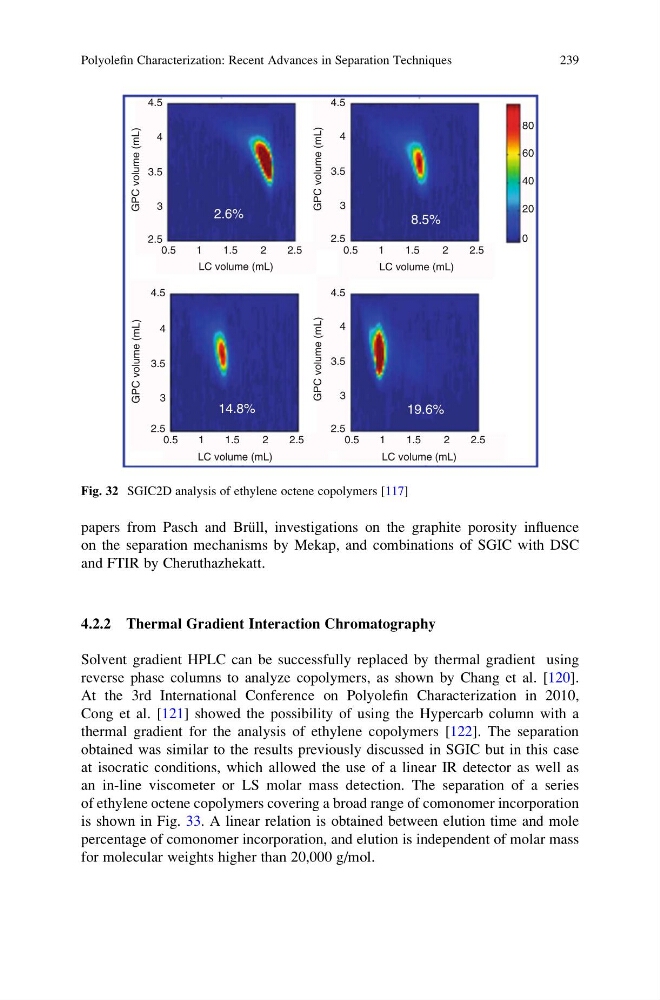
Fig. 32 SGIC2D analysis of ethylene octene copolymers [117]
Polyolefin Characterization: Recent Advances in Separation Techniques
239
on the separation mechanisms by Mekap, and combinations of SGIC with DSC
and FTIR by Cheruthazhekatt.
4.2.2 Thermal Gradient Interaction Chromatography
Solvent gradient HPLC can be successfully replaced by thermal gradient using
reverse phase columns to analyze copolymers, as shown by Chang et al. [120].
At the 3rd International Conference on Polyolefin Characterization in 2010,
Cong et al. [121] showed the possibility of using the Hypercarb column with a
thermal gradient for the analysis of ethylene copolymers [122]. The separation
obtained was similar to the results previously discussed in SGIC but in this case
at isocratic conditions, which allowed the use of a linear IR detector as well as
an in-line viscometer or LS molar mass detection. The separation of a series
of ethylene octene copolymers covering a broad range of comonomer incorporation
is shown in Fig. 33. A linear relation is obtained between elution time and mole
percentage of comonomer incorporation, and elution is independent of molar mass
for molecular weights higher than 20,000 g/mol.
LC volume (mL)
2.5
2
1.5
1
3
4
GPC volume (mL)
4.5
3.5
2.5
3
4
GPC volume (mL)
4.5
3.5
2.5
3
4
GPC volume (mL)
4.5
3.5
2.5
3
4
GPC volume (mL)
4.5
3.5
2.5
0.5
LC volume (mL)
2.5
80
0
8.5%
19.6%
14.8%
2.6%
20
40
60
2
1.5
1
0.5
LC volume (mL)
2.5
2
1.5
1
0.5
LC volume (mL)
2.5
2
1.5
1
0.5
Fig. 32 SGIC2D analysis of ethylene octene copolymers [117]
Polyolefin Characterization: Recent Advances in Separation Techniques
239