

average M n and M w values can also be practical [84], in terms of temperature or
comonomer mole percentage (when calibration is performed) as shown with (5–7):
T n ¼
P
c i
P
c i =T i
;
(5)
T W ¼
P
c i Á T i
P
c i
;
(6)
r ¼
T w
T n
:
(7)
Other parameters have been proposed in the patent literature to describe the
CCD, such as the composition distribution breadth index (CDBI), defined as
the weight percentage of the copolymer molecules having a comonomer content
within 50% of the median total molar comonomer content [95], or the solubility
distribution breadth index (SDBI), which is analogous to the standard deviation
of the CCD [96].
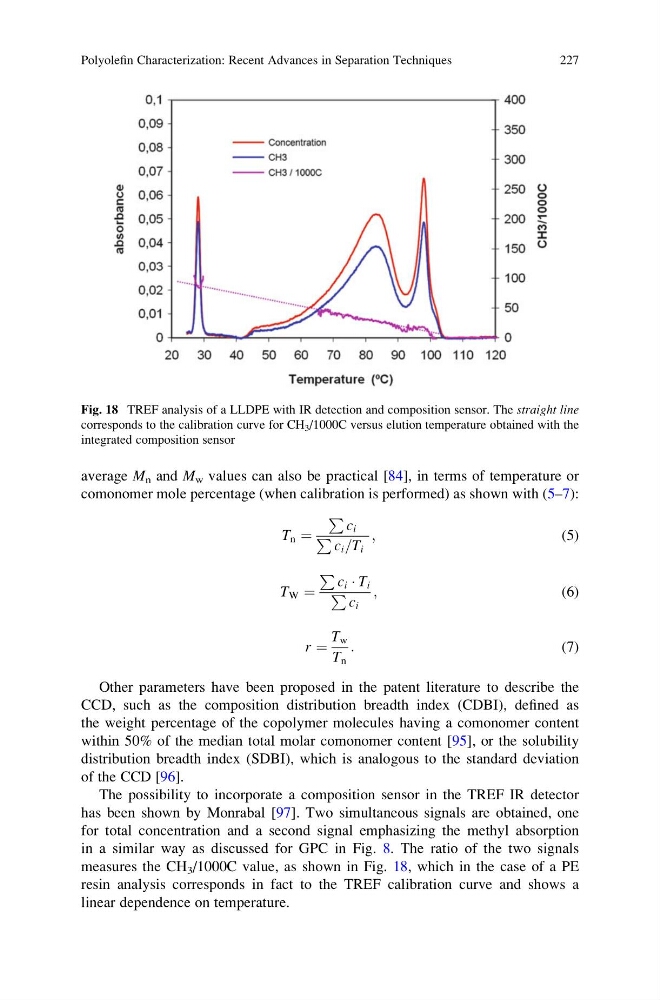
The possibility to incorporate a composition sensor in the TREF IR detector
has been shown by Monrabal [97]. Two simultaneous signals are obtained, one
for total concentration and a second signal emphasizing the methyl absorption
in a similar way as discussed for GPC in Fig. 8. The ratio of the two signals
measures the CH 3 /1000C value, as shown in Fig. 18, which in the case of a PE
resin analysis corresponds in fact to the TREF calibration curve and shows a
linear dependence on temperature.
Fig. 18 TREF analysis of a LLDPE with IR detection and composition sensor. The straight line
corresponds to the calibration curve for CH 3 /1000C versus elution temperature obtained with the
integrated composition sensor
Polyolefin Characterization: Recent Advances in Separation Techniques
227
comonomer mole percentage (when calibration is performed) as shown with (5–7):
T n ¼
P
c i
P
c i =T i
;
(5)
T W ¼
P
c i Á T i
P
c i
;
(6)
r ¼
T w
T n
:
(7)
Other parameters have been proposed in the patent literature to describe the
CCD, such as the composition distribution breadth index (CDBI), defined as
the weight percentage of the copolymer molecules having a comonomer content
within 50% of the median total molar comonomer content [95], or the solubility
distribution breadth index (SDBI), which is analogous to the standard deviation
of the CCD [96].
The possibility to incorporate a composition sensor in the TREF IR detector
has been shown by Monrabal [97]. Two simultaneous signals are obtained, one
for total concentration and a second signal emphasizing the methyl absorption
in a similar way as discussed for GPC in Fig. 8. The ratio of the two signals
measures the CH 3 /1000C value, as shown in Fig. 18, which in the case of a PE
resin analysis corresponds in fact to the TREF calibration curve and shows a
linear dependence on temperature.
Fig. 18 TREF analysis of a LLDPE with IR detection and composition sensor. The straight line
corresponds to the calibration curve for CH 3 /1000C versus elution temperature obtained with the
integrated composition sensor
Polyolefin Characterization: Recent Advances in Separation Techniques
227