

the solution to very low temperatures to achieve the overall crystallization of
the sample is not always practical and, quite often, with low crystallinity samples
it is not possible to reach it before the solvent itself crystallizes. In those cases,
a more precise representation of the CCD is shown in Fig. 15, where the continuity
of the CCD is represented down to the lowest temperature analyzed and the
remaining soluble fraction is represented by a rectangle with the corresponding
surface area at the lowest analysis temperature.
In TREF analysis, with a finite and usually large sample solution volume (V)
injected into the column, there is a physical limit to the maximum resolution
achievable, which we have defined as geometric dispersion (gd) [90], given by (4):
gd ¼ HR Á V=F;
(4)
which corresponds to the temperature range in which the same type of polymer
molecules are going to be eluted at a given heating rate HR and flow rate F.
For a sample volume of 0.5 mL injection (assuming that it will be diluted into
the column to double that volume) and using a HR of 1
C/min, a flow rate of
1 mL/min or higher is required to achieve a gd of 1
C or lower, which is acceptable
given the intrinsic low resolution of the TREF technique. The low HR/F ratios
required to achieve the lowest gd in (4) compete with the high HR/F ratios
demanded by (3) to have good detector response.
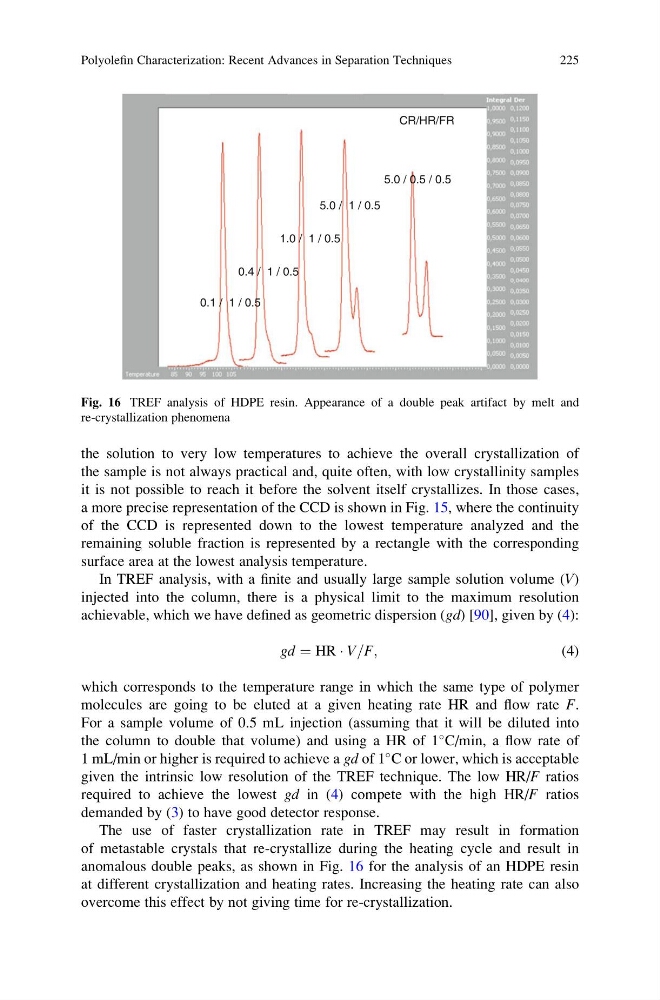
The use of faster crystallization rate in TREF may result in formation
of metastable crystals that re-crystallize during the heating cycle and result in
anomalous double peaks, as shown in Fig. 16 for the analysis of an HDPE resin
at different crystallization and heating rates. Increasing the heating rate can also
overcome this effect by not giving time for re-crystallization.
0.1 / 1 / 0.5
0.4 / 1 / 0.5
1.0 / 1 / 0.5
5.0 / 1 / 0.5
5.0 / 0.5 / 0.5
CR/HR/FR
Fig. 16 TREF analysis of HDPE resin. Appearance of a double peak artifact by melt and
re-crystallization phenomena
Polyolefin Characterization: Recent Advances in Separation Techniques
225
the sample is not always practical and, quite often, with low crystallinity samples
it is not possible to reach it before the solvent itself crystallizes. In those cases,
a more precise representation of the CCD is shown in Fig. 15, where the continuity
of the CCD is represented down to the lowest temperature analyzed and the
remaining soluble fraction is represented by a rectangle with the corresponding
surface area at the lowest analysis temperature.
In TREF analysis, with a finite and usually large sample solution volume (V)
injected into the column, there is a physical limit to the maximum resolution
achievable, which we have defined as geometric dispersion (gd) [90], given by (4):
gd ¼ HR Á V=F;
(4)
which corresponds to the temperature range in which the same type of polymer
molecules are going to be eluted at a given heating rate HR and flow rate F.
For a sample volume of 0.5 mL injection (assuming that it will be diluted into
the column to double that volume) and using a HR of 1
C/min, a flow rate of
1 mL/min or higher is required to achieve a gd of 1
C or lower, which is acceptable
given the intrinsic low resolution of the TREF technique. The low HR/F ratios
required to achieve the lowest gd in (4) compete with the high HR/F ratios
demanded by (3) to have good detector response.
The use of faster crystallization rate in TREF may result in formation
of metastable crystals that re-crystallize during the heating cycle and result in
anomalous double peaks, as shown in Fig. 16 for the analysis of an HDPE resin
at different crystallization and heating rates. Increasing the heating rate can also
overcome this effect by not giving time for re-crystallization.
0.1 / 1 / 0.5
0.4 / 1 / 0.5
1.0 / 1 / 0.5
5.0 / 1 / 0.5
5.0 / 0.5 / 0.5
CR/HR/FR
Fig. 16 TREF analysis of HDPE resin. Appearance of a double peak artifact by melt and
re-crystallization phenomena
Polyolefin Characterization: Recent Advances in Separation Techniques
225