

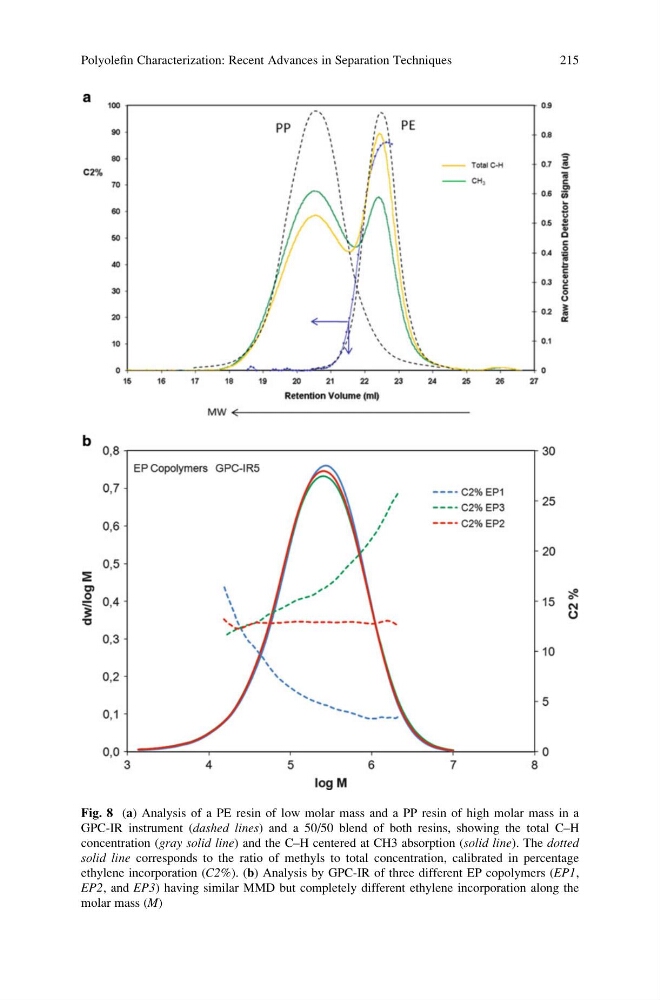
Fig. 8 (a) Analysis of a PE resin of low molar mass and a PP resin of high molar mass in a
GPC-IR instrument (dashed lines) and a 50/50 blend of both resins, showing the total C–H
concentration (gray solid line) and the C–H centered at CH3 absorption (solid line). The dotted
solid line corresponds to the ratio of methyls to total concentration, calibrated in percentage
ethylene incorporation (C2%). (b) Analysis by GPC-IR of three different EP copolymers (EP1,
EP2, and EP3) having similar MMD but completely different ethylene incorporation along the
molar mass (M)
Polyolefin Characterization: Recent Advances in Separation Techniques
215
GPC-IR instrument (dashed lines) and a 50/50 blend of both resins, showing the total C–H
concentration (gray solid line) and the C–H centered at CH3 absorption (solid line). The dotted
solid line corresponds to the ratio of methyls to total concentration, calibrated in percentage
ethylene incorporation (C2%). (b) Analysis by GPC-IR of three different EP copolymers (EP1,
EP2, and EP3) having similar MMD but completely different ethylene incorporation along the
molar mass (M)
Polyolefin Characterization: Recent Advances in Separation Techniques
215