

12 Segmentation of Symptomatic Exudate-Associated …
361
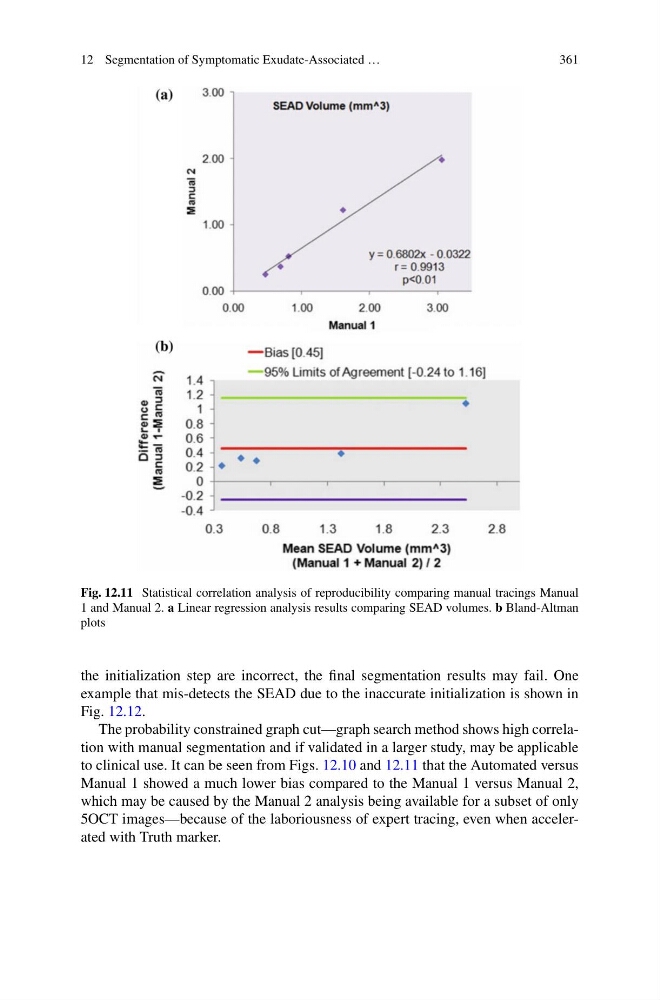
Fig. 12.11 Statistical correlation analysis of reproducibility comparing manual tracings Manual
1 and Manual 2. a Linear regression analysis results comparing SEAD volumes. b Bland-Altman
plots
the initialization step are incorrect, the final segmentation results may fail. One
example that mis-detects the SEAD due to the inaccurate initialization is shown in
Fig. 12.12.
The probability constrained graph cut—graph search method shows high correlation with manual segmentation and if validated in a larger study, may be applicable
to clinical use. It can be seen from Figs. 12.10 and 12.11 that the Automated versus
Manual 1 showed a much lower bias compared to the Manual 1 versus Manual 2,
which may be caused by the Manual 2 analysis being available for a subset of only
5OCT images—because of the laboriousness of expert tracing, even when accelerated with Truth marker.
361
Fig. 12.11 Statistical correlation analysis of reproducibility comparing manual tracings Manual
1 and Manual 2. a Linear regression analysis results comparing SEAD volumes. b Bland-Altman
plots
the initialization step are incorrect, the final segmentation results may fail. One
example that mis-detects the SEAD due to the inaccurate initialization is shown in
Fig. 12.12.
The probability constrained graph cut—graph search method shows high correlation with manual segmentation and if validated in a larger study, may be applicable
to clinical use. It can be seen from Figs. 12.10 and 12.11 that the Automated versus
Manual 1 showed a much lower bias compared to the Manual 1 versus Manual 2,
which may be caused by the Manual 2 analysis being available for a subset of only
5OCT images—because of the laboriousness of expert tracing, even when accelerated with Truth marker.