

360
L. Pan and X. Chen
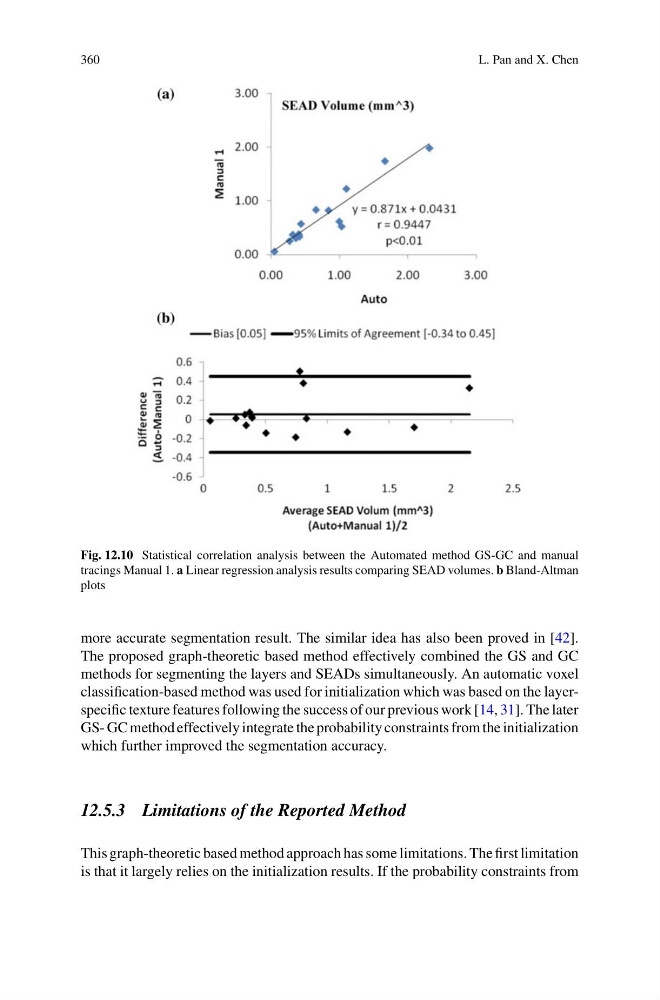
Fig. 12.10 Statistical correlation analysis between the Automated method GS-GC and manual
tracings Manual 1. a Linear regression analysis results comparing SEAD volumes. b Bland-Altman
plots
more accurate segmentation result. The similar idea has also been proved in [42].
The proposed graph-theoretic based method effectively combined the GS and GC
methods for segmenting the layers and SEADs simultaneously. An automatic voxel
classification-based method was used for initialization which was based on the layerspecific texture features following the success of our previous work [14, 31]. The later
GS- GC method effectively integrate the probability constraints from the initialization
which further improved the segmentation accuracy.
12.5.3 Limitations of the Reported Method
This graph-theoretic based method approach has some limitations. The first limitation
is that it largely relies on the initialization results. If the probability constraints from
L. Pan and X. Chen
Fig. 12.10 Statistical correlation analysis between the Automated method GS-GC and manual
tracings Manual 1. a Linear regression analysis results comparing SEAD volumes. b Bland-Altman
plots
more accurate segmentation result. The similar idea has also been proved in [42].
The proposed graph-theoretic based method effectively combined the GS and GC
methods for segmenting the layers and SEADs simultaneously. An automatic voxel
classification-based method was used for initialization which was based on the layerspecific texture features following the success of our previous work [14, 31]. The later
GS- GC method effectively integrate the probability constraints from the initialization
which further improved the segmentation accuracy.
12.5.3 Limitations of the Reported Method
This graph-theoretic based method approach has some limitations. The first limitation
is that it largely relies on the initialization results. If the probability constraints from