

12 Segmentation of Symptomatic Exudate-Associated …
359
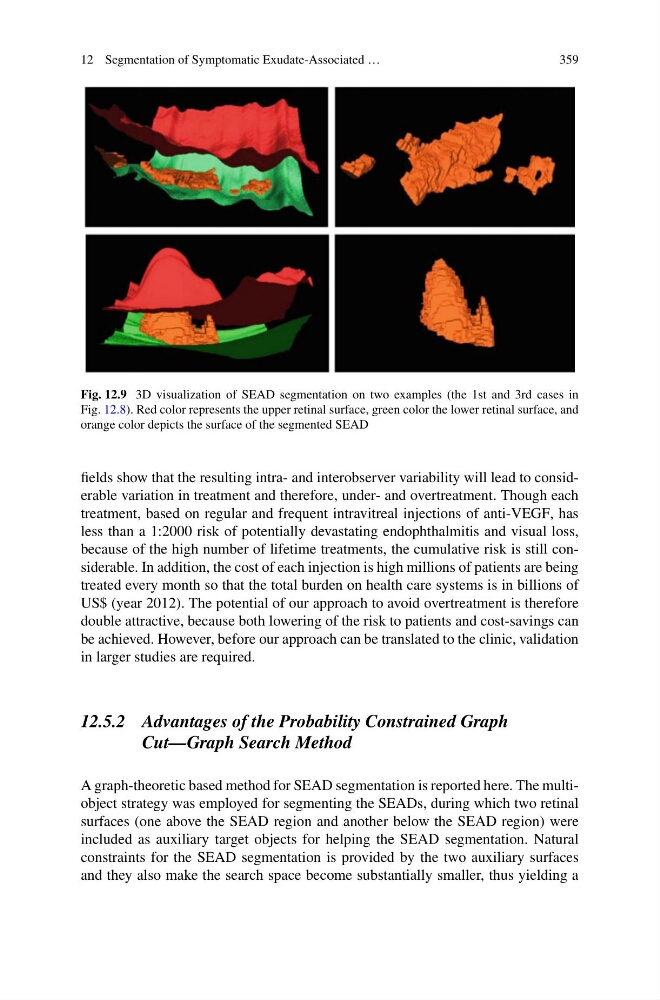
Fig. 12.9 3D visualization of SEAD segmentation on two examples (the 1st and 3rd cases in
Fig. 12.8). Red color represents the upper retinal surface, green color the lower retinal surface, and
orange color depicts the surface of the segmented SEAD
fields show that the resulting intra- and interobserver variability will lead to considerable variation in treatment and therefore, under- and overtreatment. Though each
treatment, based on regular and frequent intravitreal injections of anti-VEGF, has
less than a 1:2000 risk of potentially devastating endophthalmitis and visual loss,
because of the high number of lifetime treatments, the cumulative risk is still considerable. In addition, the cost of each injection is high millions of patients are being
treated every month so that the total burden on health care systems is in billions of
US$ (year 2012). The potential of our approach to avoid overtreatment is therefore
double attractive, because both lowering of the risk to patients and cost-savings can
be achieved. However, before our approach can be translated to the clinic, validation
in larger studies are required.
12.5.2 Advantages of the Probability Constrained Graph
Cut—Graph Search Method
A graph-theoretic based method for SEAD segmentation is reported here. The multiobject strategy was employed for segmenting the SEADs, during which two retinal
surfaces (one above the SEAD region and another below the SEAD region) were
included as auxiliary target objects for helping the SEAD segmentation. Natural
constraints for the SEAD segmentation is provided by the two auxiliary surfaces
and they also make the search space become substantially smaller, thus yielding a
359
Fig. 12.9 3D visualization of SEAD segmentation on two examples (the 1st and 3rd cases in
Fig. 12.8). Red color represents the upper retinal surface, green color the lower retinal surface, and
orange color depicts the surface of the segmented SEAD
fields show that the resulting intra- and interobserver variability will lead to considerable variation in treatment and therefore, under- and overtreatment. Though each
treatment, based on regular and frequent intravitreal injections of anti-VEGF, has
less than a 1:2000 risk of potentially devastating endophthalmitis and visual loss,
because of the high number of lifetime treatments, the cumulative risk is still considerable. In addition, the cost of each injection is high millions of patients are being
treated every month so that the total burden on health care systems is in billions of
US$ (year 2012). The potential of our approach to avoid overtreatment is therefore
double attractive, because both lowering of the risk to patients and cost-savings can
be achieved. However, before our approach can be translated to the clinic, validation
in larger studies are required.
12.5.2 Advantages of the Probability Constrained Graph
Cut—Graph Search Method
A graph-theoretic based method for SEAD segmentation is reported here. The multiobject strategy was employed for segmenting the SEADs, during which two retinal
surfaces (one above the SEAD region and another below the SEAD region) were
included as auxiliary target objects for helping the SEAD segmentation. Natural
constraints for the SEAD segmentation is provided by the two auxiliary surfaces
and they also make the search space become substantially smaller, thus yielding a