

12 Segmentation of Symptomatic Exudate-Associated …
357
Table 12.2 Mean ± standard deviation (median) of TPVF, FPVF and RVDR for initialization,
initialization after probability normalization, traditional GC in [13], traditional GS [29] and the
proposed probability constrained GS-GC
TPVF (%)
FPVF (%)
RVDR (%)
Initialization
72.3 ± 17.6 (77.5)
4.5 ± 3.7 (3.6)
21.1 ± 41.2 (16.4)
Initialization after
probability
normalization
72.5 ± 17.5 (77.5)
3.0 ± 3.2 (2.5)
20.8 ± 40.5 (16.2)
Traditional GC [13]
77.9 ± 23.9 (81.4)
3.6 ± 3.3 (3.2)
20.2 ± 37.6 (6.5)
Traditional GS [29]
82.8 ± 10.5 (86.0)
3.2 ± 4.5 (2.6)
22.8 ± 45.6 (12.5)
The proposed
probability
constrained GS-GC
86.5 ± 9.5 (90.2)
1.7 ± 2.3 (0.5)
12.8 ± 32.1 (4.5)
12.4.3 Assessment of Segmentation Performance
Three examples of the obtained segmentation results are shown in Fig. 12.8.
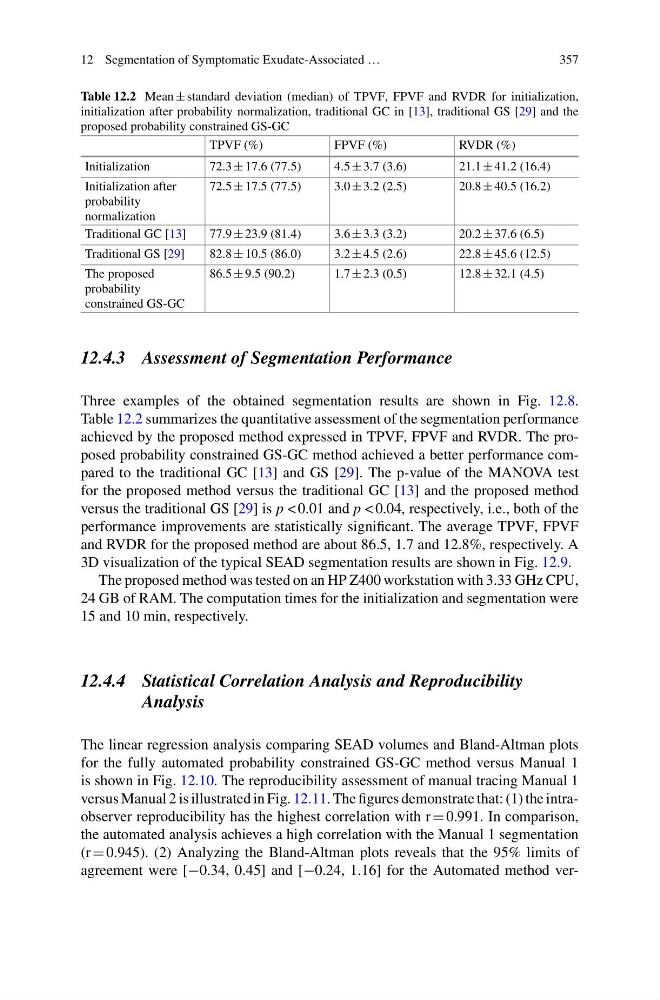
Table 12.2 summarizes the quantitative assessment of the segmentation performance
achieved by the proposed method expressed in TPVF, FPVF and RVDR. The proposed probability constrained GS-GC method achieved a better performance compared to the traditional GC [13] and GS [29]. The p-value of the MANOVA test
for the proposed method versus the traditional GC [13] and the proposed method
versus the traditional GS [29] is p < 0.01 and p < 0.04, respectively, i.e., both of the
performance improvements are statistically significant. The average TPVF, FPVF
and RVDR for the proposed method are about 86.5, 1.7 and 12.8%, respectively. A
3D visualization of the typical SEAD segmentation results are shown in Fig. 12.9.
The proposed method was tested on an HP Z400 workstation with 3.33 GHz CPU,
24 GB of RAM. The computation times for the initialization and segmentation were
15 and 10 min, respectively.
12.4.4 Statistical Correlation Analysis and Reproducibility
Analysis
The linear regression analysis comparing SEAD volumes and Bland-Altman plots
for the fully automated probability constrained GS-GC method versus Manual 1
is shown in Fig. 12.10. The reproducibility assessment of manual tracing Manual 1
versus Manual 2 is illustrated in Fig. 12.11. The figures demonstrate that: (1) the intraobserver reproducibility has the highest correlation with r 0.991. In comparison,
the automated analysis achieves a high correlation with the Manual 1 segmentation
(r 0.945). (2) Analyzing the Bland-Altman plots reveals that the 95% limits of
agreement were [−0.34, 0.45] and [−0.24, 1.16] for the Automated method ver-
357
Table 12.2 Mean ± standard deviation (median) of TPVF, FPVF and RVDR for initialization,
initialization after probability normalization, traditional GC in [13], traditional GS [29] and the
proposed probability constrained GS-GC
TPVF (%)
FPVF (%)
RVDR (%)
Initialization
72.3 ± 17.6 (77.5)
4.5 ± 3.7 (3.6)
21.1 ± 41.2 (16.4)
Initialization after
probability
normalization
72.5 ± 17.5 (77.5)
3.0 ± 3.2 (2.5)
20.8 ± 40.5 (16.2)
Traditional GC [13]
77.9 ± 23.9 (81.4)
3.6 ± 3.3 (3.2)
20.2 ± 37.6 (6.5)
Traditional GS [29]
82.8 ± 10.5 (86.0)
3.2 ± 4.5 (2.6)
22.8 ± 45.6 (12.5)
The proposed
probability
constrained GS-GC
86.5 ± 9.5 (90.2)
1.7 ± 2.3 (0.5)
12.8 ± 32.1 (4.5)
12.4.3 Assessment of Segmentation Performance
Three examples of the obtained segmentation results are shown in Fig. 12.8.
Table 12.2 summarizes the quantitative assessment of the segmentation performance
achieved by the proposed method expressed in TPVF, FPVF and RVDR. The proposed probability constrained GS-GC method achieved a better performance compared to the traditional GC [13] and GS [29]. The p-value of the MANOVA test
for the proposed method versus the traditional GC [13] and the proposed method
versus the traditional GS [29] is p < 0.01 and p < 0.04, respectively, i.e., both of the
performance improvements are statistically significant. The average TPVF, FPVF
and RVDR for the proposed method are about 86.5, 1.7 and 12.8%, respectively. A
3D visualization of the typical SEAD segmentation results are shown in Fig. 12.9.
The proposed method was tested on an HP Z400 workstation with 3.33 GHz CPU,
24 GB of RAM. The computation times for the initialization and segmentation were
15 and 10 min, respectively.
12.4.4 Statistical Correlation Analysis and Reproducibility
Analysis
The linear regression analysis comparing SEAD volumes and Bland-Altman plots
for the fully automated probability constrained GS-GC method versus Manual 1
is shown in Fig. 12.10. The reproducibility assessment of manual tracing Manual 1
versus Manual 2 is illustrated in Fig. 12.11. The figures demonstrate that: (1) the intraobserver reproducibility has the highest correlation with r 0.991. In comparison,
the automated analysis achieves a high correlation with the Manual 1 segmentation
(r 0.945). (2) Analyzing the Bland-Altman plots reveals that the 95% limits of
agreement were [−0.34, 0.45] and [−0.24, 1.16] for the Automated method ver-