

356
L. Pan and X. Chen
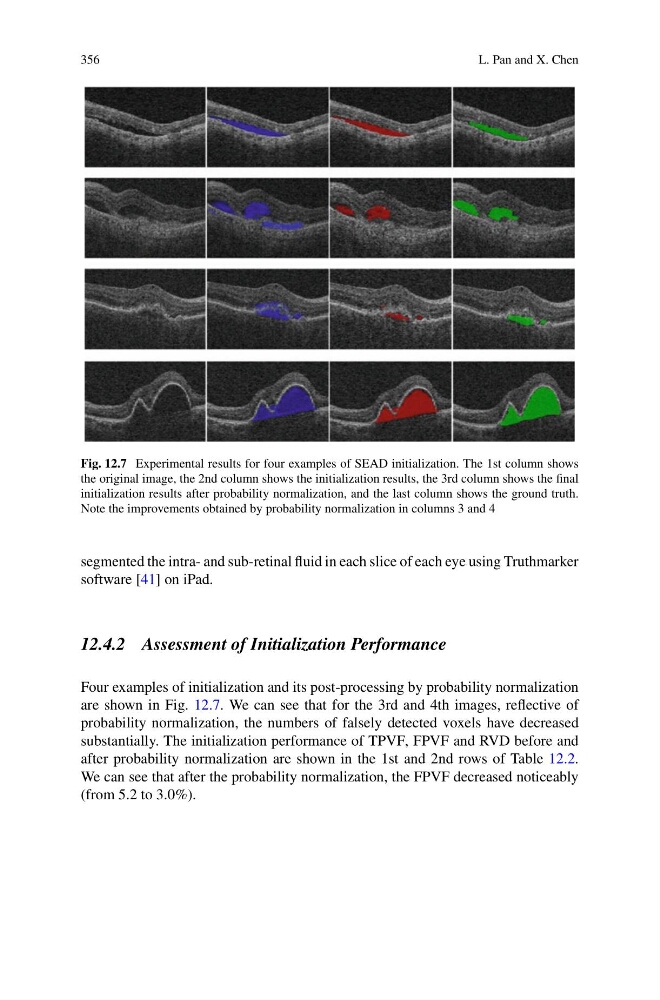
Fig. 12.7 Experimental results for four examples of SEAD initialization. The 1st column shows
the original image, the 2nd column shows the initialization results, the 3rd column shows the final
initialization results after probability normalization, and the last column shows the ground truth.
Note the improvements obtained by probability normalization in columns 3 and 4
segmented the intra- and sub-retinal fluid in each slice of each eye using Truthmarker
software [41] on iPad.
12.4.2 Assessment of Initialization Performance
Four examples of initialization and its post-processing by probability normalization
are shown in Fig. 12.7. We can see that for the 3rd and 4th images, reflective of
probability normalization, the numbers of falsely detected voxels have decreased
substantially. The initialization performance of TPVF, FPVF and RVD before and
after probability normalization are shown in the 1st and 2nd rows of Table 12.2.
We can see that after the probability normalization, the FPVF decreased noticeably
(from 5.2 to 3.0%).
L. Pan and X. Chen
Fig. 12.7 Experimental results for four examples of SEAD initialization. The 1st column shows
the original image, the 2nd column shows the initialization results, the 3rd column shows the final
initialization results after probability normalization, and the last column shows the ground truth.
Note the improvements obtained by probability normalization in columns 3 and 4
segmented the intra- and sub-retinal fluid in each slice of each eye using Truthmarker
software [41] on iPad.
12.4.2 Assessment of Initialization Performance
Four examples of initialization and its post-processing by probability normalization
are shown in Fig. 12.7. We can see that for the 3rd and 4th images, reflective of
probability normalization, the numbers of falsely detected voxels have decreased
substantially. The initialization performance of TPVF, FPVF and RVD before and
after probability normalization are shown in the 1st and 2nd rows of Table 12.2.
We can see that after the probability normalization, the FPVF decreased noticeably
(from 5.2 to 3.0%).