

12 Segmentation of Symptomatic Exudate-Associated …
351
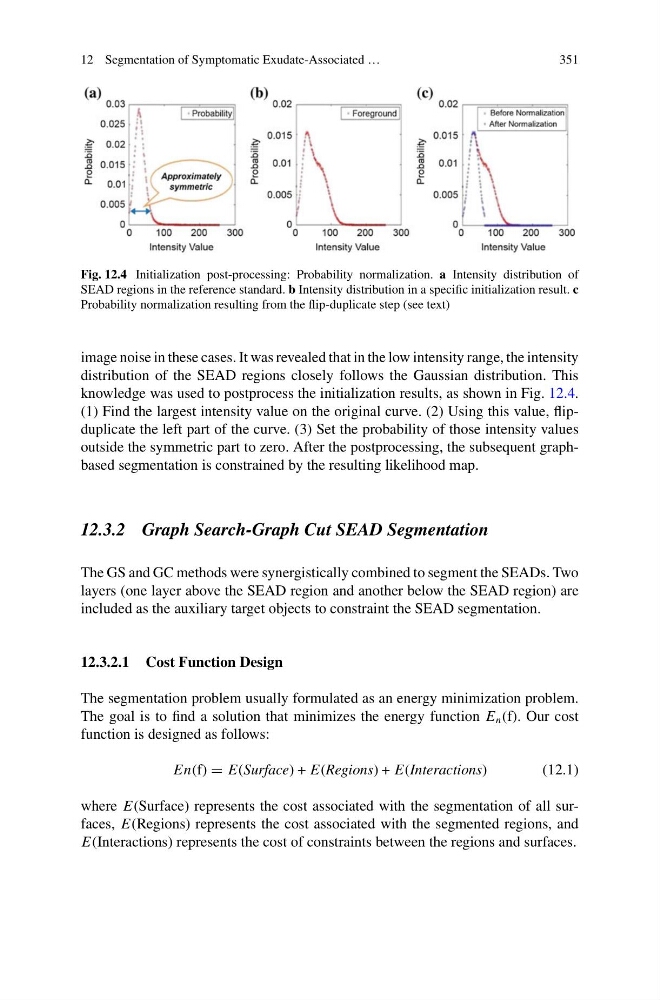
Fig. 12.4 Initialization post-processing: Probability normalization. a Intensity distribution of
SEAD regions in the reference standard. b Intensity distribution in a specific initialization result. c
Probability normalization resulting from the flip-duplicate step (see text)
image noise in these cases. It was revealed that in the low intensity range, the intensity
distribution of the SEAD regions closely follows the Gaussian distribution. This
knowledge was used to postprocess the initialization results, as shown in Fig. 12.4.
(1) Find the largest intensity value on the original curve. (2) Using this value, flipduplicate the left part of the curve. (3) Set the probability of those intensity values
outside the symmetric part to zero. After the postprocessing, the subsequent graphbased segmentation is constrained by the resulting likelihood map.
12.3.2 Graph Search-Graph Cut SEAD Segmentation
The GS and GC methods were synergistically combined to segment the SEADs. Two
layers (one layer above the SEAD region and another below the SEAD region) are
included as the auxiliary target objects to constraint the SEAD segmentation.
12.3.2.1 Cost Function Design
The segmentation problem usually formulated as an energy minimization problem.
The goal is to find a solution that minimizes the energy function E n (f). Our cost
function is designed as follows:
En(f) E(Surface) + E(Regions) + E(Interactions)
(12.1)
where E(Surface) represents the cost associated with the segmentation of all surfaces, E(Regions) represents the cost associated with the segmented regions, and
E(Interactions) represents the cost of constraints between the regions and surfaces.
351
Fig. 12.4 Initialization post-processing: Probability normalization. a Intensity distribution of
SEAD regions in the reference standard. b Intensity distribution in a specific initialization result. c
Probability normalization resulting from the flip-duplicate step (see text)
image noise in these cases. It was revealed that in the low intensity range, the intensity
distribution of the SEAD regions closely follows the Gaussian distribution. This
knowledge was used to postprocess the initialization results, as shown in Fig. 12.4.
(1) Find the largest intensity value on the original curve. (2) Using this value, flipduplicate the left part of the curve. (3) Set the probability of those intensity values
outside the symmetric part to zero. After the postprocessing, the subsequent graphbased segmentation is constrained by the resulting likelihood map.
12.3.2 Graph Search-Graph Cut SEAD Segmentation
The GS and GC methods were synergistically combined to segment the SEADs. Two
layers (one layer above the SEAD region and another below the SEAD region) are
included as the auxiliary target objects to constraint the SEAD segmentation.
12.3.2.1 Cost Function Design
The segmentation problem usually formulated as an energy minimization problem.
The goal is to find a solution that minimizes the energy function E n (f). Our cost
function is designed as follows:
En(f) E(Surface) + E(Regions) + E(Interactions)
(12.1)
where E(Surface) represents the cost associated with the segmentation of all surfaces, E(Regions) represents the cost associated with the segmented regions, and
E(Interactions) represents the cost of constraints between the regions and surfaces.