

11 Segmentation and Visualization of Drusen …
337
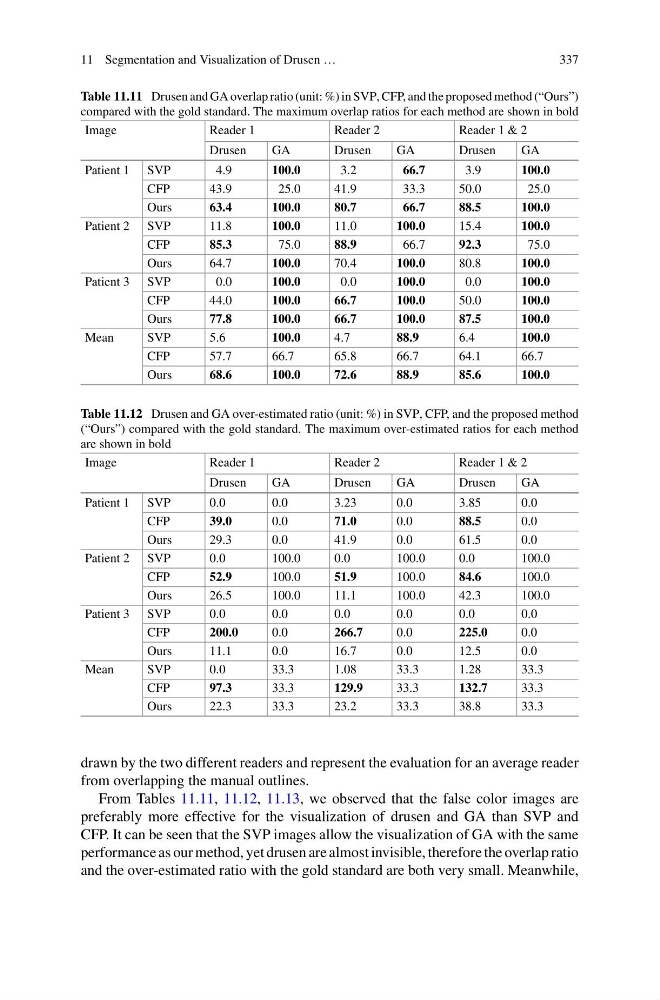
Table 11.11 Drusen and GA overlap ratio (unit: %) in SVP, CFP, and the proposed method (“Ours”)
compared with the gold standard. The maximum overlap ratios for each method are shown in bold
Image
Reader 1
Reader 2
Reader 1 & 2
Drusen
GA
Drusen
GA
Drusen
GA
Patient 1 SVP
4.9
100.0
3.2
66.7
3.9
100.0
CFP
43.9
25.0
41.9
33.3
50.0
25.0
Ours
63.4
100.0
80.7
66.7
88.5
100.0
Patient 2 SVP
11.8
100.0
11.0
100.0
15.4
100.0
CFP
85.3
75.0
88.9
66.7
92.3
75.0
Ours
64.7
100.0
70.4
100.0
80.8
100.0
Patient 3 SVP
0.0
100.0
0.0
100.0
0.0
100.0
CFP
44.0
100.0
66.7
100.0
50.0
100.0
Ours
77.8
100.0
66.7
100.0
87.5
100.0
Mean
SVP
5.6
100.0
4.7
88.9
6.4
100.0
CFP
57.7
66.7
65.8
66.7
64.1
66.7
Ours
68.6
100.0
72.6
88.9
85.6
100.0
Table 11.12 Drusen and GA over-estimated ratio (unit: %) in SVP, CFP, and the proposed method
(“Ours”) compared with the gold standard. The maximum over-estimated ratios for each method
are shown in bold
Image
Reader 1
Reader 2
Reader 1 & 2
Drusen
GA
Drusen
GA
Drusen
GA
Patient 1 SVP
0.0
0.0
3.23
0.0
3.85
0.0
CFP
39.0
0.0
71.0
0.0
88.5
0.0
Ours
29.3
0.0
41.9
0.0
61.5
0.0
Patient 2 SVP
0.0
100.0
0.0
100.0
0.0
100.0
CFP
52.9
100.0
51.9
100.0
84.6
100.0
Ours
26.5
100.0
11.1
100.0
42.3
100.0
Patient 3 SVP
0.0
0.0
0.0
0.0
0.0
0.0
CFP
200.0
0.0
266.7
0.0
225.0
0.0
Ours
11.1
0.0
16.7
0.0
12.5
0.0
Mean
SVP
0.0
33.3
1.08
33.3
1.28
33.3
CFP
97.3
33.3
129.9
33.3
132.7
33.3
Ours
22.3
33.3
23.2
33.3
38.8
33.3
drawn by the two different readers and represent the evaluation for an average reader
from overlapping the manual outlines.
From Tables 11.11, 11.12, 11.13, we observed that the false color images are
preferably more effective for the visualization of drusen and GA than SVP and
CFP. It can be seen that the SVP images allow the visualization of GA with the same
performance as our method, yet drusen are almost invisible, therefore the overlap ratio
and the over-estimated ratio with the gold standard are both very small. Meanwhile,
337
Table 11.11 Drusen and GA overlap ratio (unit: %) in SVP, CFP, and the proposed method (“Ours”)
compared with the gold standard. The maximum overlap ratios for each method are shown in bold
Image
Reader 1
Reader 2
Reader 1 & 2
Drusen
GA
Drusen
GA
Drusen
GA
Patient 1 SVP
4.9
100.0
3.2
66.7
3.9
100.0
CFP
43.9
25.0
41.9
33.3
50.0
25.0
Ours
63.4
100.0
80.7
66.7
88.5
100.0
Patient 2 SVP
11.8
100.0
11.0
100.0
15.4
100.0
CFP
85.3
75.0
88.9
66.7
92.3
75.0
Ours
64.7
100.0
70.4
100.0
80.8
100.0
Patient 3 SVP
0.0
100.0
0.0
100.0
0.0
100.0
CFP
44.0
100.0
66.7
100.0
50.0
100.0
Ours
77.8
100.0
66.7
100.0
87.5
100.0
Mean
SVP
5.6
100.0
4.7
88.9
6.4
100.0
CFP
57.7
66.7
65.8
66.7
64.1
66.7
Ours
68.6
100.0
72.6
88.9
85.6
100.0
Table 11.12 Drusen and GA over-estimated ratio (unit: %) in SVP, CFP, and the proposed method
(“Ours”) compared with the gold standard. The maximum over-estimated ratios for each method
are shown in bold
Image
Reader 1
Reader 2
Reader 1 & 2
Drusen
GA
Drusen
GA
Drusen
GA
Patient 1 SVP
0.0
0.0
3.23
0.0
3.85
0.0
CFP
39.0
0.0
71.0
0.0
88.5
0.0
Ours
29.3
0.0
41.9
0.0
61.5
0.0
Patient 2 SVP
0.0
100.0
0.0
100.0
0.0
100.0
CFP
52.9
100.0
51.9
100.0
84.6
100.0
Ours
26.5
100.0
11.1
100.0
42.3
100.0
Patient 3 SVP
0.0
0.0
0.0
0.0
0.0
0.0
CFP
200.0
0.0
266.7
0.0
225.0
0.0
Ours
11.1
0.0
16.7
0.0
12.5
0.0
Mean
SVP
0.0
33.3
1.08
33.3
1.28
33.3
CFP
97.3
33.3
129.9
33.3
132.7
33.3
Ours
22.3
33.3
23.2
33.3
38.8
33.3
drawn by the two different readers and represent the evaluation for an average reader
from overlapping the manual outlines.
From Tables 11.11, 11.12, 11.13, we observed that the false color images are
preferably more effective for the visualization of drusen and GA than SVP and
CFP. It can be seen that the SVP images allow the visualization of GA with the same
performance as our method, yet drusen are almost invisible, therefore the overlap ratio
and the over-estimated ratio with the gold standard are both very small. Meanwhile,