

338
Q. Chen et al.
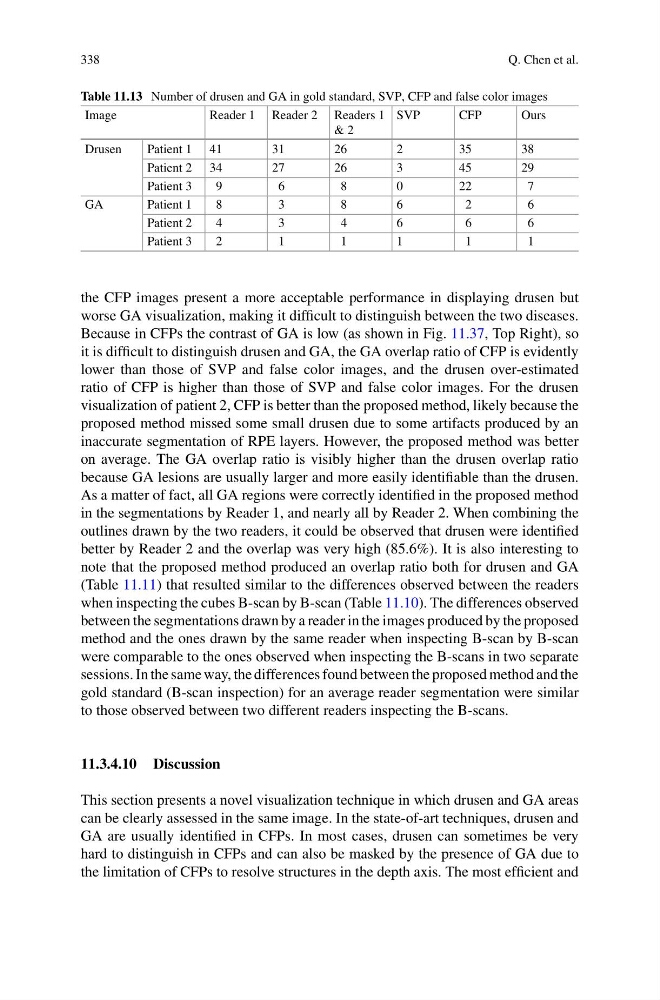
Table 11.13 Number of drusen and GA in gold standard, SVP, CFP and false color images
Image
Reader 1 Reader 2 Readers 1
& 2
SVP
CFP
Ours
Drusen
Patient 1 41
31
26
2
35
38
Patient 2 34
27
26
3
45
29
Patient 3
9
6
8
0
22
7
GA
Patient 1
8
3
8
6
2
6
Patient 2
4
3
4
6
6
6
Patient 3
2
1
1
1
1
1
the CFP images present a more acceptable performance in displaying drusen but
worse GA visualization, making it difficult to distinguish between the two diseases.
Because in CFPs the contrast of GA is low (as shown in Fig. 11.37, Top Right), so
it is difficult to distinguish drusen and GA, the GA overlap ratio of CFP is evidently
lower than those of SVP and false color images, and the drusen over-estimated
ratio of CFP is higher than those of SVP and false color images. For the drusen
visualization of patient 2, CFP is better than the proposed method, likely because the
proposed method missed some small drusen due to some artifacts produced by an
inaccurate segmentation of RPE layers. However, the proposed method was better
on average. The GA overlap ratio is visibly higher than the drusen overlap ratio
because GA lesions are usually larger and more easily identifiable than the drusen.
As a matter of fact, all GA regions were correctly identified in the proposed method
in the segmentations by Reader 1, and nearly all by Reader 2. When combining the
outlines drawn by the two readers, it could be observed that drusen were identified
better by Reader 2 and the overlap was very high (85.6%). It is also interesting to
note that the proposed method produced an overlap ratio both for drusen and GA
(Table 11.11) that resulted similar to the differences observed between the readers
when inspecting the cubes B-scan by B-scan (Table 11.10). The differences observed
between the segmentations drawn by a reader in the images produced by the proposed
method and the ones drawn by the same reader when inspecting B-scan by B-scan
were comparable to the ones observed when inspecting the B-scans in two separate
sessions. In the same way, the differences found between the proposed method and the
gold standard (B-scan inspection) for an average reader segmentation were similar
to those observed between two different readers inspecting the B-scans.
11.3.4.10 Discussion
This section presents a novel visualization technique in which drusen and GA areas
can be clearly assessed in the same image. In the state-of-art techniques, drusen and
GA are usually identified in CFPs. In most cases, drusen can sometimes be very
hard to distinguish in CFPs and can also be masked by the presence of GA due to
the limitation of CFPs to resolve structures in the depth axis. The most efficient and
Q. Chen et al.
Table 11.13 Number of drusen and GA in gold standard, SVP, CFP and false color images
Image
Reader 1 Reader 2 Readers 1
& 2
SVP
CFP
Ours
Drusen
Patient 1 41
31
26
2
35
38
Patient 2 34
27
26
3
45
29
Patient 3
9
6
8
0
22
7
GA
Patient 1
8
3
8
6
2
6
Patient 2
4
3
4
6
6
6
Patient 3
2
1
1
1
1
1
the CFP images present a more acceptable performance in displaying drusen but
worse GA visualization, making it difficult to distinguish between the two diseases.
Because in CFPs the contrast of GA is low (as shown in Fig. 11.37, Top Right), so
it is difficult to distinguish drusen and GA, the GA overlap ratio of CFP is evidently
lower than those of SVP and false color images, and the drusen over-estimated
ratio of CFP is higher than those of SVP and false color images. For the drusen
visualization of patient 2, CFP is better than the proposed method, likely because the
proposed method missed some small drusen due to some artifacts produced by an
inaccurate segmentation of RPE layers. However, the proposed method was better
on average. The GA overlap ratio is visibly higher than the drusen overlap ratio
because GA lesions are usually larger and more easily identifiable than the drusen.
As a matter of fact, all GA regions were correctly identified in the proposed method
in the segmentations by Reader 1, and nearly all by Reader 2. When combining the
outlines drawn by the two readers, it could be observed that drusen were identified
better by Reader 2 and the overlap was very high (85.6%). It is also interesting to
note that the proposed method produced an overlap ratio both for drusen and GA
(Table 11.11) that resulted similar to the differences observed between the readers
when inspecting the cubes B-scan by B-scan (Table 11.10). The differences observed
between the segmentations drawn by a reader in the images produced by the proposed
method and the ones drawn by the same reader when inspecting B-scan by B-scan
were comparable to the ones observed when inspecting the B-scans in two separate
sessions. In the same way, the differences found between the proposed method and the
gold standard (B-scan inspection) for an average reader segmentation were similar
to those observed between two different readers inspecting the B-scans.
11.3.4.10 Discussion
This section presents a novel visualization technique in which drusen and GA areas
can be clearly assessed in the same image. In the state-of-art techniques, drusen and
GA are usually identified in CFPs. In most cases, drusen can sometimes be very
hard to distinguish in CFPs and can also be masked by the presence of GA due to
the limitation of CFPs to resolve structures in the depth axis. The most efficient and