

336
Q. Chen et al.
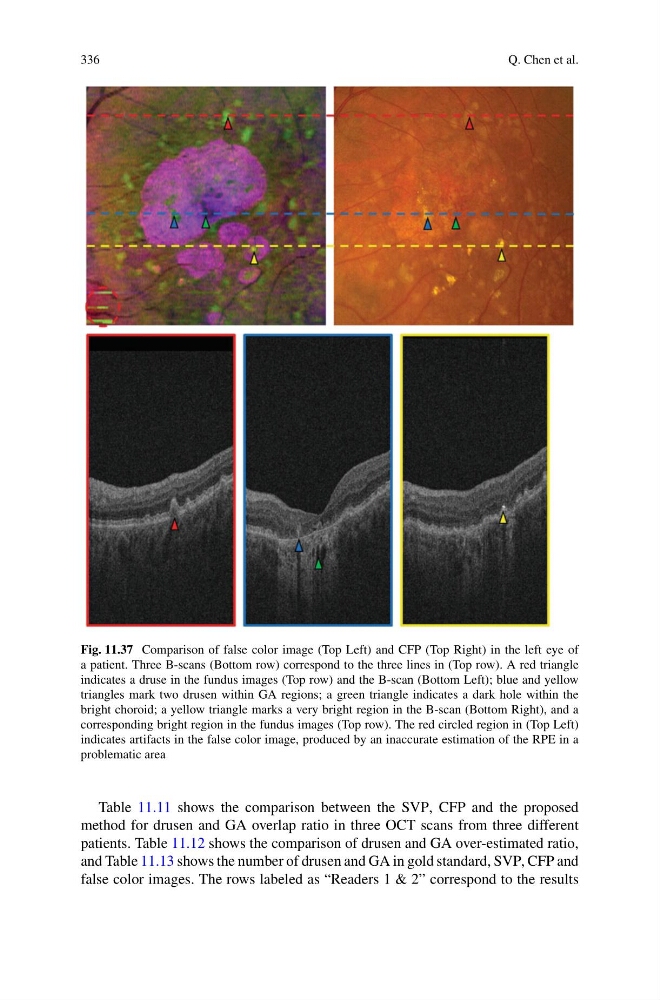
Fig. 11.37 Comparison of false color image (Top Left) and CFP (Top Right) in the left eye of
a patient. Three B-scans (Bottom row) correspond to the three lines in (Top row). A red triangle
indicates a druse in the fundus images (Top row) and the B-scan (Bottom Left); blue and yellow
triangles mark two drusen within GA regions; a green triangle indicates a dark hole within the
bright choroid; a yellow triangle marks a very bright region in the B-scan (Bottom Right), and a
corresponding bright region in the fundus images (Top row). The red circled region in (Top Left)
indicates artifacts in the false color image, produced by an inaccurate estimation of the RPE in a
problematic area
Table 11.11 shows the comparison between the SVP, CFP and the proposed
method for drusen and GA overlap ratio in three OCT scans from three different
patients. Table 11.12 shows the comparison of drusen and GA over-estimated ratio,
and Table 11.13 shows the number of drusen and GA in gold standard, SVP, CFP and
false color images. The rows labeled as “Readers 1 & 2” correspond to the results
Q. Chen et al.
Fig. 11.37 Comparison of false color image (Top Left) and CFP (Top Right) in the left eye of
a patient. Three B-scans (Bottom row) correspond to the three lines in (Top row). A red triangle
indicates a druse in the fundus images (Top row) and the B-scan (Bottom Left); blue and yellow
triangles mark two drusen within GA regions; a green triangle indicates a dark hole within the
bright choroid; a yellow triangle marks a very bright region in the B-scan (Bottom Right), and a
corresponding bright region in the fundus images (Top row). The red circled region in (Top Left)
indicates artifacts in the false color image, produced by an inaccurate estimation of the RPE in a
problematic area
Table 11.11 shows the comparison between the SVP, CFP and the proposed
method for drusen and GA overlap ratio in three OCT scans from three different
patients. Table 11.12 shows the comparison of drusen and GA over-estimated ratio,
and Table 11.13 shows the number of drusen and GA in gold standard, SVP, CFP and
false color images. The rows labeled as “Readers 1 & 2” correspond to the results