

11 Segmentation and Visualization of Drusen …
335
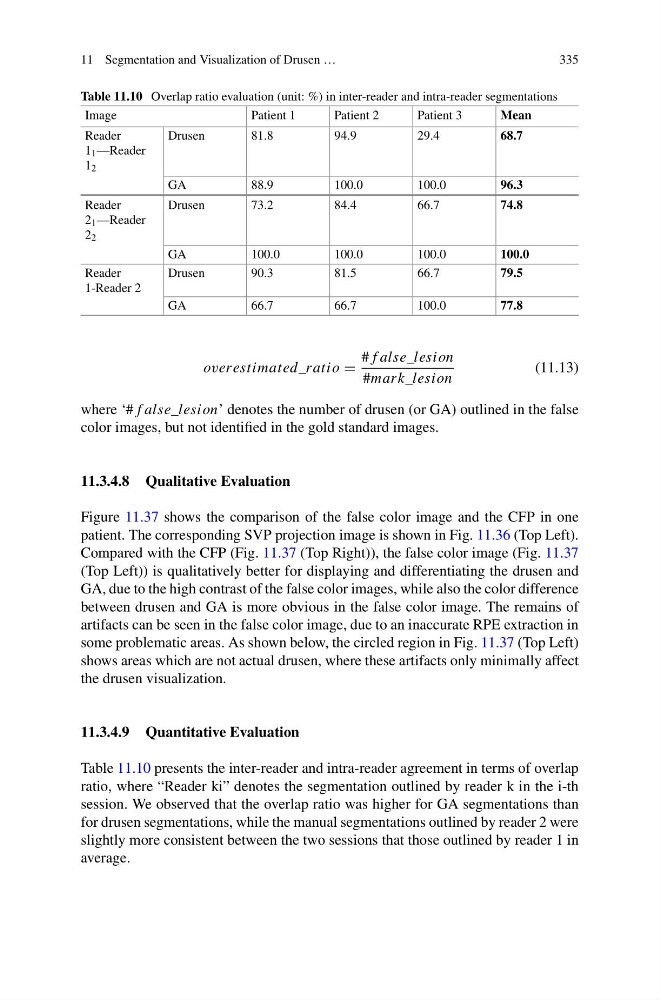
Table 11.10 Overlap ratio evaluation (unit: %) in inter-reader and intra-reader segmentations
Image
Patient 1
Patient 2
Patient 3
Mean
Reader
1 1 —Reader
1 2
Drusen
81.8
94.9
29.4
68.7
GA
88.9
100.0
100.0
96.3
Reader
2 1 —Reader
2 2
Drusen
73.2
84.4
66.7
74.8
GA
100.0
100.0
100.0
100.0
Reader
1-Reader 2
Drusen
90.3
81.5
66.7
79.5
GA
66.7
66.7
100.0
77.8
over estimated_ratio
# f alse_lesion
#mark_lesion
(11.13)
where ‘# f alse_lesion’ denotes the number of drusen (or GA) outlined in the false
color images, but not identified in the gold standard images.
11.3.4.8 Qualitative Evaluation
Figure 11.37 shows the comparison of the false color image and the CFP in one
patient. The corresponding SVP projection image is shown in Fig. 11.36 (Top Left).
Compared with the CFP (Fig. 11.37 (Top Right)), the false color image (Fig. 11.37
(Top Left)) is qualitatively better for displaying and differentiating the drusen and
GA, due to the high contrast of the false color images, while also the color difference
between drusen and GA is more obvious in the false color image. The remains of
artifacts can be seen in the false color image, due to an inaccurate RPE extraction in
some problematic areas. As shown below, the circled region in Fig. 11.37 (Top Left)
shows areas which are not actual drusen, where these artifacts only minimally affect
the drusen visualization.
11.3.4.9 Quantitative Evaluation
Table 11.10 presents the inter-reader and intra-reader agreement in terms of overlap
ratio, where “Reader ki” denotes the segmentation outlined by reader k in the i-th
session. We observed that the overlap ratio was higher for GA segmentations than
for drusen segmentations, while the manual segmentations outlined by reader 2 were
slightly more consistent between the two sessions that those outlined by reader 1 in
average.
335
Table 11.10 Overlap ratio evaluation (unit: %) in inter-reader and intra-reader segmentations
Image
Patient 1
Patient 2
Patient 3
Mean
Reader
1 1 —Reader
1 2
Drusen
81.8
94.9
29.4
68.7
GA
88.9
100.0
100.0
96.3
Reader
2 1 —Reader
2 2
Drusen
73.2
84.4
66.7
74.8
GA
100.0
100.0
100.0
100.0
Reader
1-Reader 2
Drusen
90.3
81.5
66.7
79.5
GA
66.7
66.7
100.0
77.8
over estimated_ratio
# f alse_lesion
#mark_lesion
(11.13)
where ‘# f alse_lesion’ denotes the number of drusen (or GA) outlined in the false
color images, but not identified in the gold standard images.
11.3.4.8 Qualitative Evaluation
Figure 11.37 shows the comparison of the false color image and the CFP in one
patient. The corresponding SVP projection image is shown in Fig. 11.36 (Top Left).
Compared with the CFP (Fig. 11.37 (Top Right)), the false color image (Fig. 11.37
(Top Left)) is qualitatively better for displaying and differentiating the drusen and
GA, due to the high contrast of the false color images, while also the color difference
between drusen and GA is more obvious in the false color image. The remains of
artifacts can be seen in the false color image, due to an inaccurate RPE extraction in
some problematic areas. As shown below, the circled region in Fig. 11.37 (Top Left)
shows areas which are not actual drusen, where these artifacts only minimally affect
the drusen visualization.
11.3.4.9 Quantitative Evaluation
Table 11.10 presents the inter-reader and intra-reader agreement in terms of overlap
ratio, where “Reader ki” denotes the segmentation outlined by reader k in the i-th
session. We observed that the overlap ratio was higher for GA segmentations than
for drusen segmentations, while the manual segmentations outlined by reader 2 were
slightly more consistent between the two sessions that those outlined by reader 1 in
average.