

334
Q. Chen et al.
drusen and GA lesions in the CFPs, SVP and false color image of these patients was
done to qualitatively assess the drusen and GA visualization in each technique. Only
two different cases from two patients are qualitatively discussed, due to the length
limitation of this chapter.
A good assessment of drusen and GA can be done by looking at each B-scan in
an SD-OCT cube. To quantitatively evaluate drusen and GA visualization in false
color images, three SD-OCT cubes from three patients were reviewed independently,
B-scan by B-scan (128 B-scans per cube), by two readers (NSJ and SJJ) in order to
create a gold standard. Both readers had expertise in reviewing OCT retinal studies.
Manually marking all 128 B-scans each cube was a very tedious task and time
consuming, so only three of the 82 available SD-OCT cubes were reviewed in this
quantitative study. We randomly selected three cases from the set of 82. Each of
the readers independently marked drusen in the OCT B-scans by hand, in a similar
manner as in [62]. To enable the assessment of intra-reader variation, each of the
reader marked each image twice in two different sessions. The marked bars were
then collapsed along the depth axis to produce an en face drusen/GA location maps
(called “marking images”), which we used as the gold standard for our quantitative
evaluation. We combined the two segmentations of the drusen (or GA) made by each
reader in the two separate reading sessions using their intersection to produce a single
outline per reader per image. More so, we applied the same intersection operation
between the two segmentations made by different readers for each drusen (or GA)
outline, producing a combined reader result.
We also outlined the drusen and GA by hand in the corresponding CFPs, SVP
and false color images. The outlines images were then compared quantitatively to
the images manually marked by the readers (the gold standard). The outlines are
not precise, due to the blurred boundaries of drusen and GA in CFPs, SVP and false
color images. As such, we used an overlap ratio of the number of visualized lesions as
the metric to quantitatively evaluate drusen and GA visualization in each technique,
instead of pixel by pixel classification:
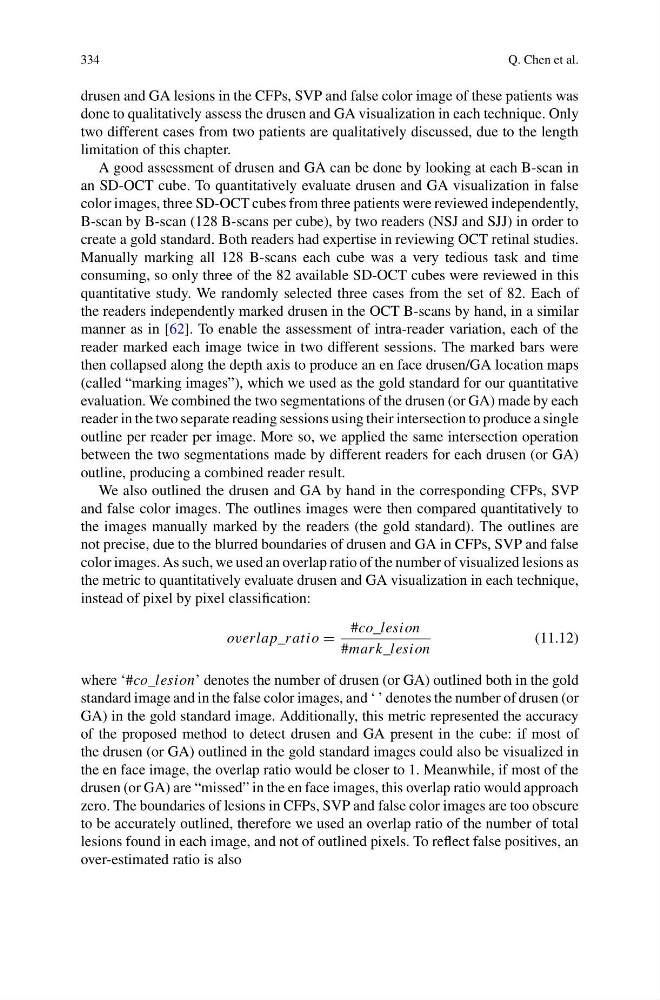
overlap_ratio
#co_lesion
#mark_lesion
(11.12)
where ‘#co_lesion’ denotes the number of drusen (or GA) outlined both in the gold
standard image and in the false color images, and ‘ ’ denotes the number of drusen (or
GA) in the gold standard image. Additionally, this metric represented the accuracy
of the proposed method to detect drusen and GA present in the cube: if most of
the drusen (or GA) outlined in the gold standard images could also be visualized in
the en face image, the overlap ratio would be closer to 1. Meanwhile, if most of the
drusen (or GA) are “missed” in the en face images, this overlap ratio would approach
zero. The boundaries of lesions in CFPs, SVP and false color images are too obscure
to be accurately outlined, therefore we used an overlap ratio of the number of total
lesions found in each image, and not of outlined pixels. To reflect false positives, an
over-estimated ratio is also
Q. Chen et al.
drusen and GA lesions in the CFPs, SVP and false color image of these patients was
done to qualitatively assess the drusen and GA visualization in each technique. Only
two different cases from two patients are qualitatively discussed, due to the length
limitation of this chapter.
A good assessment of drusen and GA can be done by looking at each B-scan in
an SD-OCT cube. To quantitatively evaluate drusen and GA visualization in false
color images, three SD-OCT cubes from three patients were reviewed independently,
B-scan by B-scan (128 B-scans per cube), by two readers (NSJ and SJJ) in order to
create a gold standard. Both readers had expertise in reviewing OCT retinal studies.
Manually marking all 128 B-scans each cube was a very tedious task and time
consuming, so only three of the 82 available SD-OCT cubes were reviewed in this
quantitative study. We randomly selected three cases from the set of 82. Each of
the readers independently marked drusen in the OCT B-scans by hand, in a similar
manner as in [62]. To enable the assessment of intra-reader variation, each of the
reader marked each image twice in two different sessions. The marked bars were
then collapsed along the depth axis to produce an en face drusen/GA location maps
(called “marking images”), which we used as the gold standard for our quantitative
evaluation. We combined the two segmentations of the drusen (or GA) made by each
reader in the two separate reading sessions using their intersection to produce a single
outline per reader per image. More so, we applied the same intersection operation
between the two segmentations made by different readers for each drusen (or GA)
outline, producing a combined reader result.
We also outlined the drusen and GA by hand in the corresponding CFPs, SVP
and false color images. The outlines images were then compared quantitatively to
the images manually marked by the readers (the gold standard). The outlines are
not precise, due to the blurred boundaries of drusen and GA in CFPs, SVP and false
color images. As such, we used an overlap ratio of the number of visualized lesions as
the metric to quantitatively evaluate drusen and GA visualization in each technique,
instead of pixel by pixel classification:
overlap_ratio
#co_lesion
#mark_lesion
(11.12)
where ‘#co_lesion’ denotes the number of drusen (or GA) outlined both in the gold
standard image and in the false color images, and ‘ ’ denotes the number of drusen (or
GA) in the gold standard image. Additionally, this metric represented the accuracy
of the proposed method to detect drusen and GA present in the cube: if most of
the drusen (or GA) outlined in the gold standard images could also be visualized in
the en face image, the overlap ratio would be closer to 1. Meanwhile, if most of the
drusen (or GA) are “missed” in the en face images, this overlap ratio would approach
zero. The boundaries of lesions in CFPs, SVP and false color images are too obscure
to be accurately outlined, therefore we used an overlap ratio of the number of total
lesions found in each image, and not of outlined pixels. To reflect false positives, an
over-estimated ratio is also