

11 Segmentation and Visualization of Drusen …
333
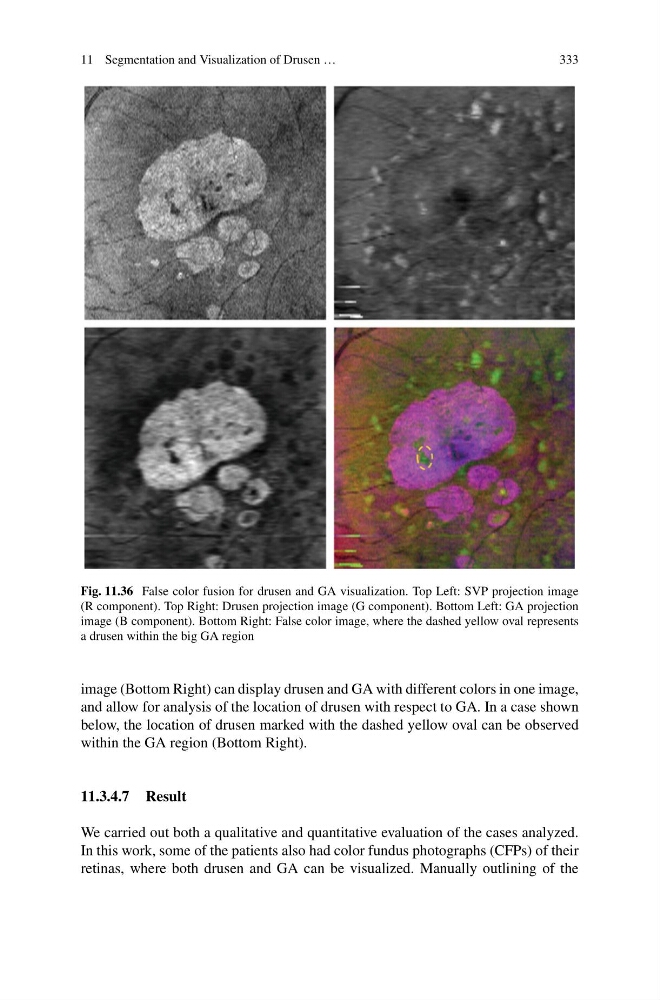
Fig. 11.36 False color fusion for drusen and GA visualization. Top Left: SVP projection image
(R component). Top Right: Drusen projection image (G component). Bottom Left: GA projection
image (B component). Bottom Right: False color image, where the dashed yellow oval represents
a drusen within the big GA region
image (Bottom Right) can display drusen and GA with different colors in one image,
and allow for analysis of the location of drusen with respect to GA. In a case shown
below, the location of drusen marked with the dashed yellow oval can be observed
within the GA region (Bottom Right).
11.3.4.7 Result
We carried out both a qualitative and quantitative evaluation of the cases analyzed.
In this work, some of the patients also had color fundus photographs (CFPs) of their
retinas, where both drusen and GA can be visualized. Manually outlining of the
333
Fig. 11.36 False color fusion for drusen and GA visualization. Top Left: SVP projection image
(R component). Top Right: Drusen projection image (G component). Bottom Left: GA projection
image (B component). Bottom Right: False color image, where the dashed yellow oval represents
a drusen within the big GA region
image (Bottom Right) can display drusen and GA with different colors in one image,
and allow for analysis of the location of drusen with respect to GA. In a case shown
below, the location of drusen marked with the dashed yellow oval can be observed
within the GA region (Bottom Right).
11.3.4.7 Result
We carried out both a qualitative and quantitative evaluation of the cases analyzed.
In this work, some of the patients also had color fundus photographs (CFPs) of their
retinas, where both drusen and GA can be visualized. Manually outlining of the