

326
Q. Chen et al.
GA region
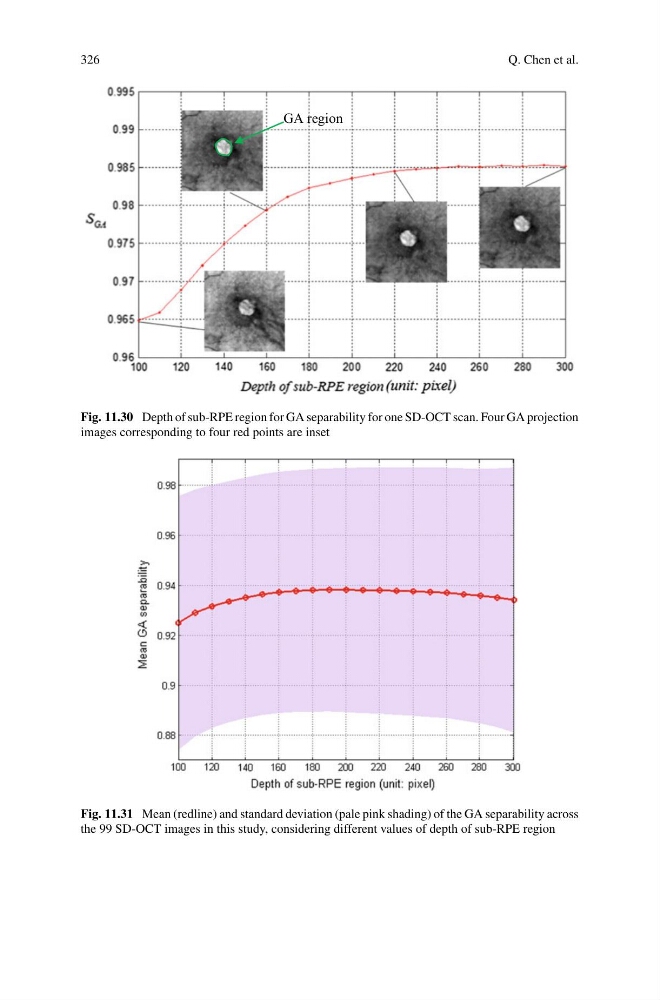
Fig. 11.30 Depth of sub-RPE region for GA separability for one SD-OCT scan. Four GA projection
images corresponding to four red points are inset
Fig. 11.31 Mean (redline) and standard deviation (pale pink shading) of the GA separability across
the 99 SD-OCT images in this study, considering different values of depth of sub-RPE region
Q. Chen et al.
GA region
Fig. 11.30 Depth of sub-RPE region for GA separability for one SD-OCT scan. Four GA projection
images corresponding to four red points are inset
Fig. 11.31 Mean (redline) and standard deviation (pale pink shading) of the GA separability across
the 99 SD-OCT images in this study, considering different values of depth of sub-RPE region