

11 Segmentation and Visualization of Drusen …
325
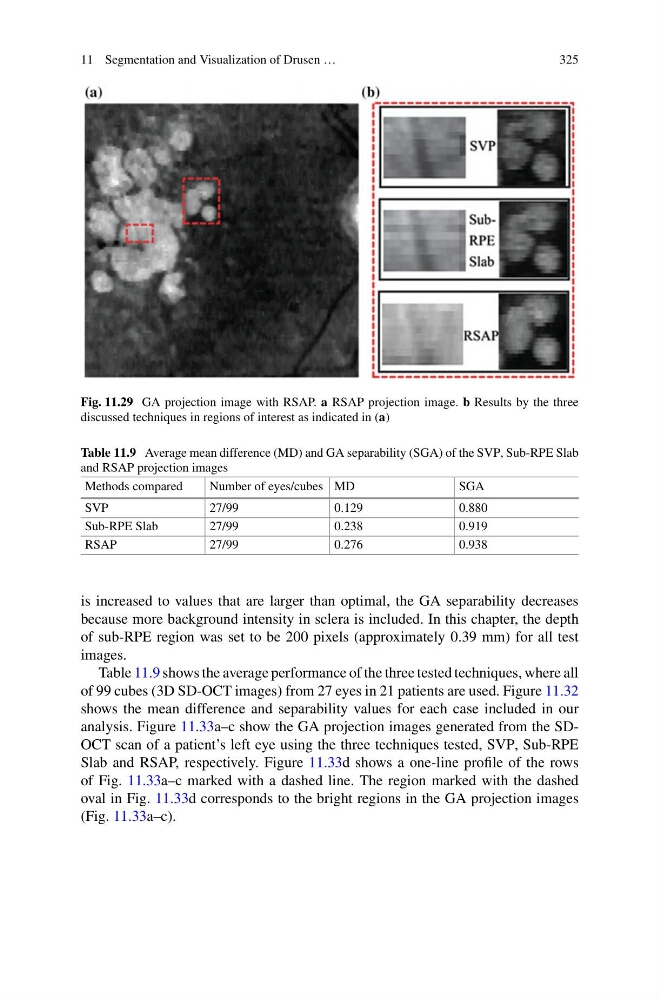
Fig. 11.29 GA projection image with RSAP. a RSAP projection image. b Results by the three
discussed techniques in regions of interest as indicated in (a)
Table 11.9 Average mean difference (MD) and GA separability (SGA) of the SVP, Sub-RPE Slab
and RSAP projection images
Methods compared
Number of eyes/cubes MD
SGA
SVP
27/99
0.129
0.880
Sub-RPE Slab
27/99
0.238
0.919
RSAP
27/99
0.276
0.938
is increased to values that are larger than optimal, the GA separability decreases
because more background intensity in sclera is included. In this chapter, the depth
of sub-RPE region was set to be 200 pixels (approximately 0.39 mm) for all test
images.
Table 11.9 shows the average performance of the three tested techniques, where all
of 99 cubes (3D SD-OCT images) from 27 eyes in 21 patients are used. Figure 11.32
shows the mean difference and separability values for each case included in our
analysis. Figure 11.33a–c show the GA projection images generated from the SDOCT scan of a patient’s left eye using the three techniques tested, SVP, Sub-RPE
Slab and RSAP, respectively. Figure 11.33d shows a one-line profile of the rows
of Fig. 11.33a–c marked with a dashed line. The region marked with the dashed
oval in Fig. 11.33d corresponds to the bright regions in the GA projection images
(Fig. 11.33a–c).
325
Fig. 11.29 GA projection image with RSAP. a RSAP projection image. b Results by the three
discussed techniques in regions of interest as indicated in (a)
Table 11.9 Average mean difference (MD) and GA separability (SGA) of the SVP, Sub-RPE Slab
and RSAP projection images
Methods compared
Number of eyes/cubes MD
SGA
SVP
27/99
0.129
0.880
Sub-RPE Slab
27/99
0.238
0.919
RSAP
27/99
0.276
0.938
is increased to values that are larger than optimal, the GA separability decreases
because more background intensity in sclera is included. In this chapter, the depth
of sub-RPE region was set to be 200 pixels (approximately 0.39 mm) for all test
images.
Table 11.9 shows the average performance of the three tested techniques, where all
of 99 cubes (3D SD-OCT images) from 27 eyes in 21 patients are used. Figure 11.32
shows the mean difference and separability values for each case included in our
analysis. Figure 11.33a–c show the GA projection images generated from the SDOCT scan of a patient’s left eye using the three techniques tested, SVP, Sub-RPE
Slab and RSAP, respectively. Figure 11.33d shows a one-line profile of the rows
of Fig. 11.33a–c marked with a dashed line. The region marked with the dashed
oval in Fig. 11.33d corresponds to the bright regions in the GA projection images
(Fig. 11.33a–c).