

324
Q. Chen et al.
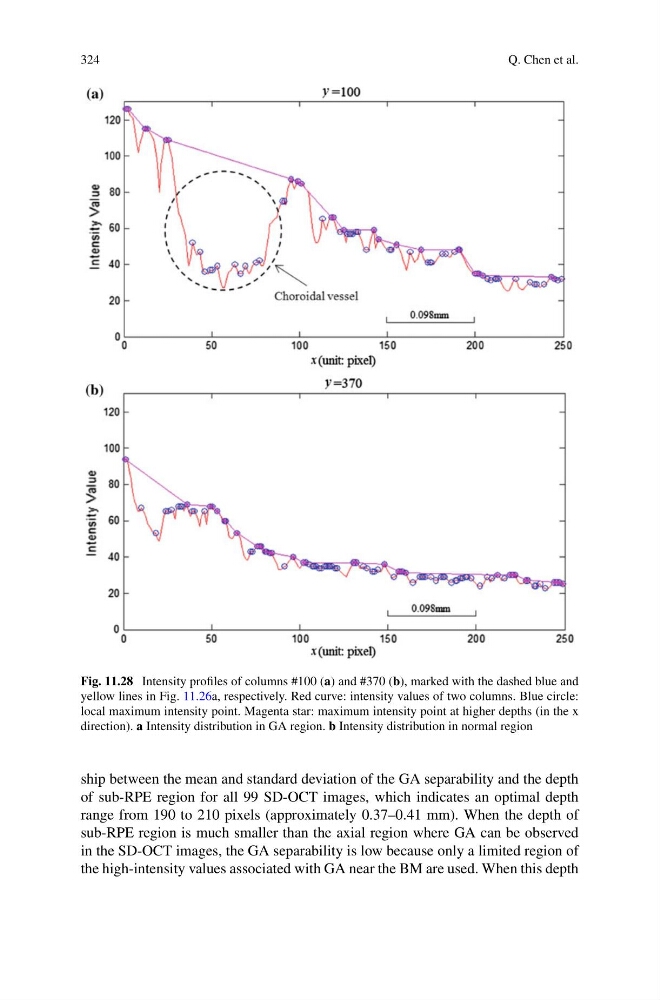
Fig. 11.28 Intensity profiles of columns #100 (a) and #370 (b), marked with the dashed blue and
yellow lines in Fig. 11.26a, respectively. Red curve: intensity values of two columns. Blue circle:
local maximum intensity point. Magenta star: maximum intensity point at higher depths (in the x
direction). a Intensity distribution in GA region. b Intensity distribution in normal region
ship between the mean and standard deviation of the GA separability and the depth
of sub-RPE region for all 99 SD-OCT images, which indicates an optimal depth
range from 190 to 210 pixels (approximately 0.37–0.41 mm). When the depth of
sub-RPE region is much smaller than the axial region where GA can be observed
in the SD-OCT images, the GA separability is low because only a limited region of
the high-intensity values associated with GA near the BM are used. When this depth
Q. Chen et al.
Fig. 11.28 Intensity profiles of columns #100 (a) and #370 (b), marked with the dashed blue and
yellow lines in Fig. 11.26a, respectively. Red curve: intensity values of two columns. Blue circle:
local maximum intensity point. Magenta star: maximum intensity point at higher depths (in the x
direction). a Intensity distribution in GA region. b Intensity distribution in normal region
ship between the mean and standard deviation of the GA separability and the depth
of sub-RPE region for all 99 SD-OCT images, which indicates an optimal depth
range from 190 to 210 pixels (approximately 0.37–0.41 mm). When the depth of
sub-RPE region is much smaller than the axial region where GA can be observed
in the SD-OCT images, the GA separability is low because only a limited region of
the high-intensity values associated with GA near the BM are used. When this depth