

318
Q. Chen et al.
Table 11.7 Quantitative comparison of our algorithm segmentation results (shown in boldface and
between parenthesis) and QC’s method results to manual gold standard (Avg. Expert) and individual
reader segmentation
QC’s
(OurSeg.)
versus Avg.
Expert
QC’s
(OurSeg.)
versus Expert
A 1
QC’s
(OurSeg.)
versus Expert
A 2
QC’s
(OurSeg.)
versus Expert
B 1
QC’s
(OurSeg.)
versus Expert
B 2
Patients/cubes 8/55
8/55
8/55
8/55
8/55
cc
0.970 (0.979) 0.967 (0.975) 0.964 (0.976) 0.968 (0.976) 0.977 (0.975)
p-value
(U-test)
0.026 (0.221) 0.047 (0.389) 0.024 (0.201) 0.017 (0.138) 0.022 (0.191)
AAD [mm 2 ] 1.438 ± 1.26 1.308 ± 1.28 1.404 ± 1.31 1.597 ± 1.33 1.465 ± 1.14
(0.811
± 0.94)
(0.758
± 0.99)
(0.853
± 1.04)
(0.984
± 1.08)
(0.897
± 1.05)
AAD [%]
27.17 ± 22.06 25.23 ± 22.71 26.14 ± 21.48 29.21 ± 22.17 27.62 ± 20.57
(12.95
± 11.83)
(12.62
± 12.86)
(13.32
± 12.74)
(14.91
± 12.65)
(14.07
± 11.78)
OR [%]
72.60 ± 15.35 73.26 ± 15.61 73.12 ± 15.15 71.16 ± 15.42 72.09 ± 14.82
(81.86
± 12.01)
(81.42
± 12.12)
(81.61
± 12.29)
(80.05
± 13.05)
(80.65
± 12.51)
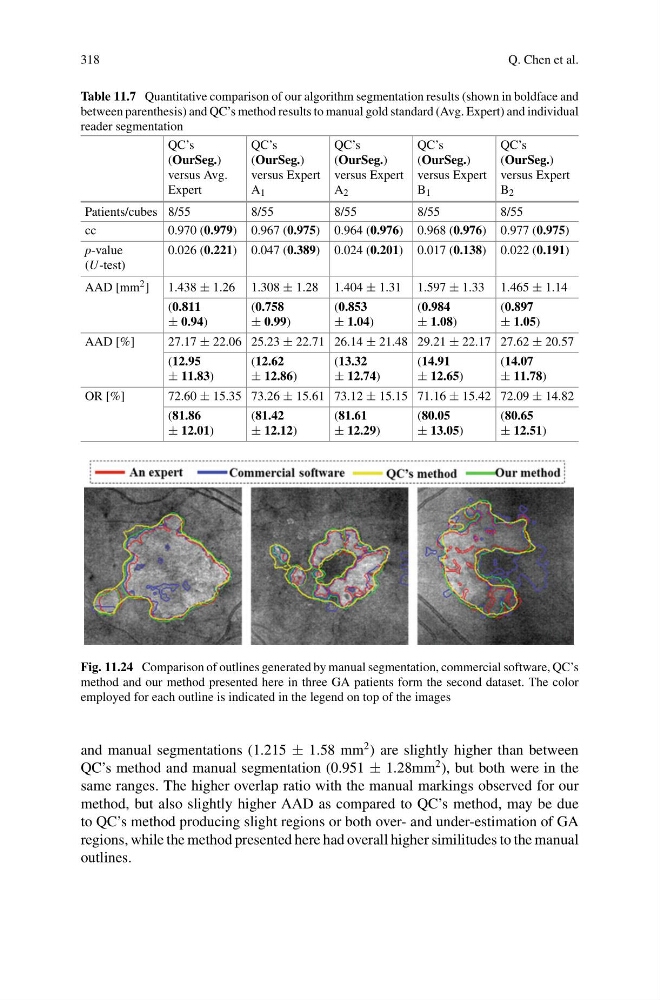
Fig. 11.24 Comparison of outlines generated by manual segmentation, commercial software, QC’s
method and our method presented here in three GA patients form the second dataset. The color
employed for each outline is indicated in the legend on top of the images
and manual segmentations (1.215 ± 1.58 mm
2 ) are slightly higher than between
QC’s method and manual segmentation (0.951 ± 1.28mm
2 ), but both were in the
same ranges. The higher overlap ratio with the manual markings observed for our
method, but also slightly higher AAD as compared to QC’s method, may be due
to QC’s method producing slight regions or both over- and under-estimation of GA
regions, while the method presented here had overall higher similitudes to the manual
outlines.
Q. Chen et al.
Table 11.7 Quantitative comparison of our algorithm segmentation results (shown in boldface and
between parenthesis) and QC’s method results to manual gold standard (Avg. Expert) and individual
reader segmentation
QC’s
(OurSeg.)
versus Avg.
Expert
QC’s
(OurSeg.)
versus Expert
A 1
QC’s
(OurSeg.)
versus Expert
A 2
QC’s
(OurSeg.)
versus Expert
B 1
QC’s
(OurSeg.)
versus Expert
B 2
Patients/cubes 8/55
8/55
8/55
8/55
8/55
cc
0.970 (0.979) 0.967 (0.975) 0.964 (0.976) 0.968 (0.976) 0.977 (0.975)
p-value
(U-test)
0.026 (0.221) 0.047 (0.389) 0.024 (0.201) 0.017 (0.138) 0.022 (0.191)
AAD [mm 2 ] 1.438 ± 1.26 1.308 ± 1.28 1.404 ± 1.31 1.597 ± 1.33 1.465 ± 1.14
(0.811
± 0.94)
(0.758
± 0.99)
(0.853
± 1.04)
(0.984
± 1.08)
(0.897
± 1.05)
AAD [%]
27.17 ± 22.06 25.23 ± 22.71 26.14 ± 21.48 29.21 ± 22.17 27.62 ± 20.57
(12.95
± 11.83)
(12.62
± 12.86)
(13.32
± 12.74)
(14.91
± 12.65)
(14.07
± 11.78)
OR [%]
72.60 ± 15.35 73.26 ± 15.61 73.12 ± 15.15 71.16 ± 15.42 72.09 ± 14.82
(81.86
± 12.01)
(81.42
± 12.12)
(81.61
± 12.29)
(80.05
± 13.05)
(80.65
± 12.51)
Fig. 11.24 Comparison of outlines generated by manual segmentation, commercial software, QC’s
method and our method presented here in three GA patients form the second dataset. The color
employed for each outline is indicated in the legend on top of the images
and manual segmentations (1.215 ± 1.58 mm
2 ) are slightly higher than between
QC’s method and manual segmentation (0.951 ± 1.28mm
2 ), but both were in the
same ranges. The higher overlap ratio with the manual markings observed for our
method, but also slightly higher AAD as compared to QC’s method, may be due
to QC’s method producing slight regions or both over- and under-estimation of GA
regions, while the method presented here had overall higher similitudes to the manual
outlines.