

11 Segmentation and Visualization of Drusen …
317
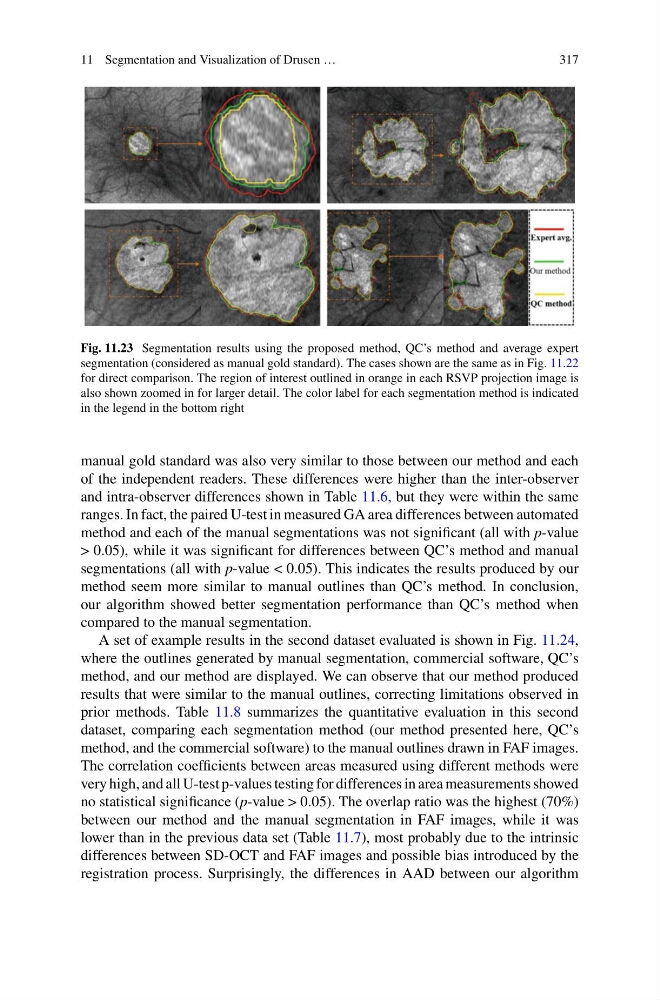
Fig. 11.23 Segmentation results using the proposed method, QC’s method and average expert
segmentation (considered as manual gold standard). The cases shown are the same as in Fig. 11.22
for direct comparison. The region of interest outlined in orange in each RSVP projection image is
also shown zoomed in for larger detail. The color label for each segmentation method is indicated
in the legend in the bottom right
manual gold standard was also very similar to those between our method and each
of the independent readers. These differences were higher than the inter-observer
and intra-observer differences shown in Table 11.6, but they were within the same
ranges. In fact, the paired U-test in measured GA area differences between automated
method and each of the manual segmentations was not significant (all with p-value
> 0.05), while it was significant for differences between QC’s method and manual
segmentations (all with p-value < 0.05). This indicates the results produced by our
method seem more similar to manual outlines than QC’s method. In conclusion,
our algorithm showed better segmentation performance than QC’s method when
compared to the manual segmentation.
A set of example results in the second dataset evaluated is shown in Fig. 11.24,
where the outlines generated by manual segmentation, commercial software, QC’s
method, and our method are displayed. We can observe that our method produced
results that were similar to the manual outlines, correcting limitations observed in
prior methods. Table 11.8 summarizes the quantitative evaluation in this second
dataset, comparing each segmentation method (our method presented here, QC’s
method, and the commercial software) to the manual outlines drawn in FAF images.
The correlation coefficients between areas measured using different methods were
very high, and all U-test p-values testing for differences in area measurements showed
no statistical significance (p-value > 0.05). The overlap ratio was the highest (70%)
between our method and the manual segmentation in FAF images, while it was
lower than in the previous data set (Table 11.7), most probably due to the intrinsic
differences between SD-OCT and FAF images and possible bias introduced by the
registration process. Surprisingly, the differences in AAD between our algorithm
317
Fig. 11.23 Segmentation results using the proposed method, QC’s method and average expert
segmentation (considered as manual gold standard). The cases shown are the same as in Fig. 11.22
for direct comparison. The region of interest outlined in orange in each RSVP projection image is
also shown zoomed in for larger detail. The color label for each segmentation method is indicated
in the legend in the bottom right
manual gold standard was also very similar to those between our method and each
of the independent readers. These differences were higher than the inter-observer
and intra-observer differences shown in Table 11.6, but they were within the same
ranges. In fact, the paired U-test in measured GA area differences between automated
method and each of the manual segmentations was not significant (all with p-value
> 0.05), while it was significant for differences between QC’s method and manual
segmentations (all with p-value < 0.05). This indicates the results produced by our
method seem more similar to manual outlines than QC’s method. In conclusion,
our algorithm showed better segmentation performance than QC’s method when
compared to the manual segmentation.
A set of example results in the second dataset evaluated is shown in Fig. 11.24,
where the outlines generated by manual segmentation, commercial software, QC’s
method, and our method are displayed. We can observe that our method produced
results that were similar to the manual outlines, correcting limitations observed in
prior methods. Table 11.8 summarizes the quantitative evaluation in this second
dataset, comparing each segmentation method (our method presented here, QC’s
method, and the commercial software) to the manual outlines drawn in FAF images.
The correlation coefficients between areas measured using different methods were
very high, and all U-test p-values testing for differences in area measurements showed
no statistical significance (p-value > 0.05). The overlap ratio was the highest (70%)
between our method and the manual segmentation in FAF images, while it was
lower than in the previous data set (Table 11.7), most probably due to the intrinsic
differences between SD-OCT and FAF images and possible bias introduced by the
registration process. Surprisingly, the differences in AAD between our algorithm