

316
Q. Chen et al.
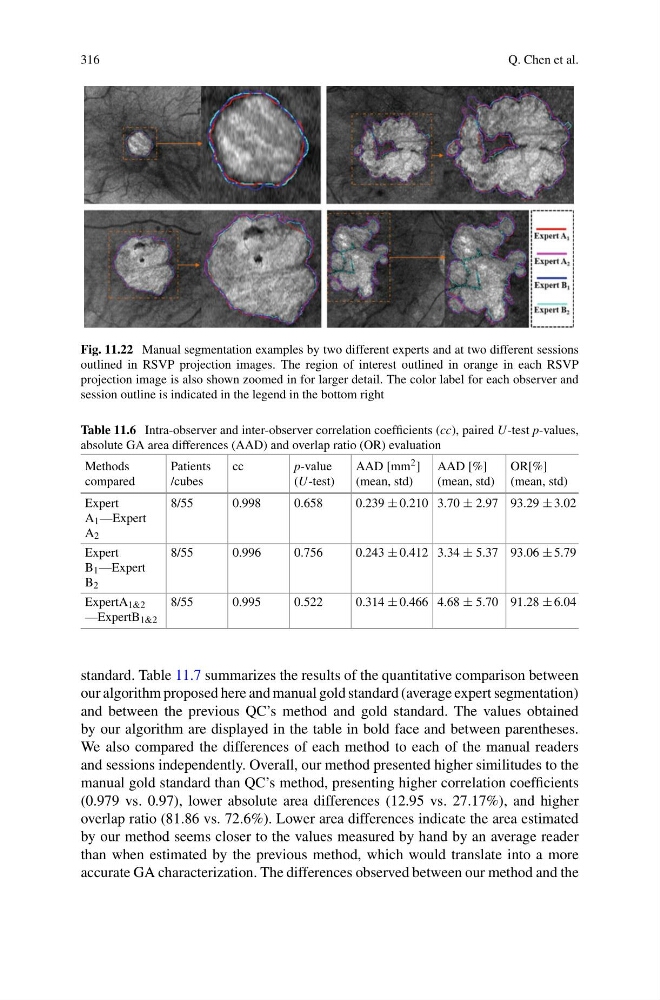
Fig. 11.22 Manual segmentation examples by two different experts and at two different sessions
outlined in RSVP projection images. The region of interest outlined in orange in each RSVP
projection image is also shown zoomed in for larger detail. The color label for each observer and
session outline is indicated in the legend in the bottom right
Table 11.6 Intra-observer and inter-observer correlation coefficients (cc), paired U-test p-values,
absolute GA area differences (AAD) and overlap ratio (OR) evaluation
Methods
compared
Patients
/cubes
cc
p-value
(U-test)
AAD [mm 2 ]
(mean, std)
AAD [%]
(mean, std)
OR[%]
(mean, std)
Expert
A 1 —Expert
A 2
8/55
0.998
0.658
0.239 ± 0.210 3.70 ± 2.97 93.29 ± 3.02
Expert
B 1 —Expert
B 2
8/55
0.996
0.756
0.243 ± 0.412 3.34 ± 5.37 93.06 ± 5.79
ExpertA 1&2
—ExpertB 1&2
8/55
0.995
0.522
0.314 ± 0.466 4.68 ± 5.70 91.28 ± 6.04
standard. Table 11.7 summarizes the results of the quantitative comparison between
our algorithm proposed here and manual gold standard (average expert segmentation)
and between the previous QC’s method and gold standard. The values obtained
by our algorithm are displayed in the table in bold face and between parentheses.
We also compared the differences of each method to each of the manual readers
and sessions independently. Overall, our method presented higher similitudes to the
manual gold standard than QC’s method, presenting higher correlation coefficients
(0.979 vs. 0.97), lower absolute area differences (12.95 vs. 27.17%), and higher
overlap ratio (81.86 vs. 72.6%). Lower area differences indicate the area estimated
by our method seems closer to the values measured by hand by an average reader
than when estimated by the previous method, which would translate into a more
accurate GA characterization. The differences observed between our method and the
Q. Chen et al.
Fig. 11.22 Manual segmentation examples by two different experts and at two different sessions
outlined in RSVP projection images. The region of interest outlined in orange in each RSVP
projection image is also shown zoomed in for larger detail. The color label for each observer and
session outline is indicated in the legend in the bottom right
Table 11.6 Intra-observer and inter-observer correlation coefficients (cc), paired U-test p-values,
absolute GA area differences (AAD) and overlap ratio (OR) evaluation
Methods
compared
Patients
/cubes
cc
p-value
(U-test)
AAD [mm 2 ]
(mean, std)
AAD [%]
(mean, std)
OR[%]
(mean, std)
Expert
A 1 —Expert
A 2
8/55
0.998
0.658
0.239 ± 0.210 3.70 ± 2.97 93.29 ± 3.02
Expert
B 1 —Expert
B 2
8/55
0.996
0.756
0.243 ± 0.412 3.34 ± 5.37 93.06 ± 5.79
ExpertA 1&2
—ExpertB 1&2
8/55
0.995
0.522
0.314 ± 0.466 4.68 ± 5.70 91.28 ± 6.04
standard. Table 11.7 summarizes the results of the quantitative comparison between
our algorithm proposed here and manual gold standard (average expert segmentation)
and between the previous QC’s method and gold standard. The values obtained
by our algorithm are displayed in the table in bold face and between parentheses.
We also compared the differences of each method to each of the manual readers
and sessions independently. Overall, our method presented higher similitudes to the
manual gold standard than QC’s method, presenting higher correlation coefficients
(0.979 vs. 0.97), lower absolute area differences (12.95 vs. 27.17%), and higher
overlap ratio (81.86 vs. 72.6%). Lower area differences indicate the area estimated
by our method seems closer to the values measured by hand by an average reader
than when estimated by the previous method, which would translate into a more
accurate GA characterization. The differences observed between our method and the