

11 Segmentation and Visualization of Drusen …
315
Figure 11.22, displays example collected manual outlines in examples from the
first test dataset (as indicted in Sect. 2.5) with outlines made by the two readers at the
two repeated sessions indicated with different colors. The intra-observer and interobserver differences can be visualized. The quantitative results in inter-observer
and intra-observer agreement evaluation for this first dataset are summarized in
Table 11.6, where A i (i 1, 2) represents the segmentations of the first grader
in the i-th session, and B i (i 1, 2) represents the segmentations of the second
grader in the i-th session. Inter-observer differences were computed by considering
the union of both sessions for each grader: A 1&2 and B 1&2 represent the first and second grader, respectively. The intra-observer and inter-observer comparison showed
very high correlations coefficients (cc) and U-test p-values, indicating very high linear correlation and no statistical differences both between different readers and for
the same reader at different sessions. The overlap ratios (all > 90%) and the absolute
GA area differences (all < 5%) indicate very high inter-observer and intra-observer
agreement, highlighting that the measurement and quantification of GA regions in
the generated projection images seem effective and feasible.
We evaluated the performance of the proposed segmentation algorithm in the first
dataset by comparing its results to the manual segmentation gold standard and to the
previously published QC’s method. The results obtained for four example cases are
shown in Fig. 11.23. We can observe that for these cases, the GA outlines obtained
by QC’s method slightly deviate from the gold standard boundary (expert average),
whereas the segmentation results obtained by our method seem closer to such gold
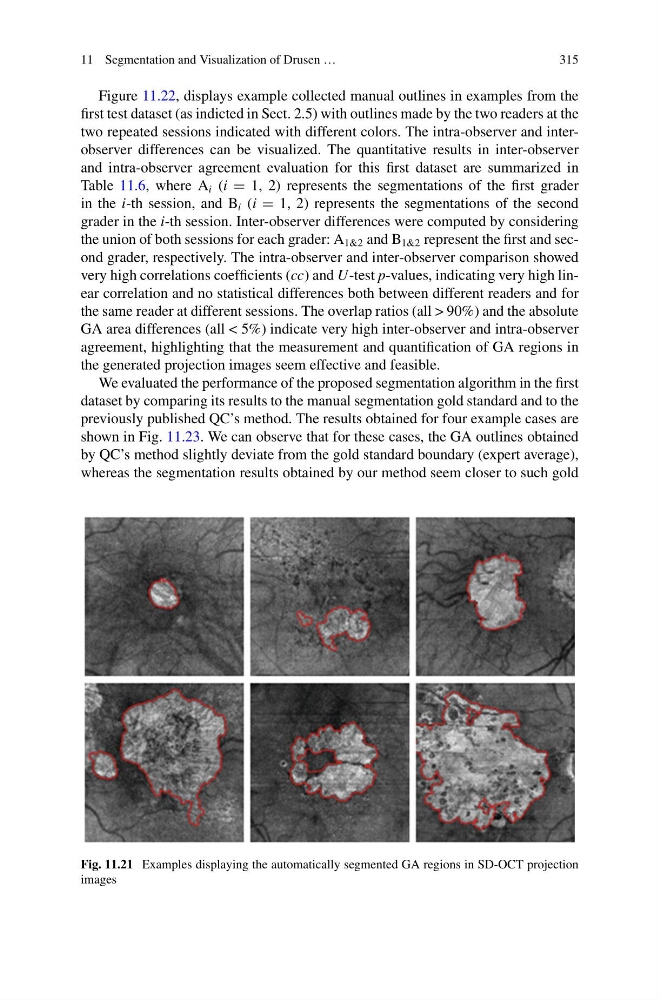
Fig. 11.21 Examples displaying the automatically segmented GA regions in SD-OCT projection
images
315
Figure 11.22, displays example collected manual outlines in examples from the
first test dataset (as indicted in Sect. 2.5) with outlines made by the two readers at the
two repeated sessions indicated with different colors. The intra-observer and interobserver differences can be visualized. The quantitative results in inter-observer
and intra-observer agreement evaluation for this first dataset are summarized in
Table 11.6, where A i (i 1, 2) represents the segmentations of the first grader
in the i-th session, and B i (i 1, 2) represents the segmentations of the second
grader in the i-th session. Inter-observer differences were computed by considering
the union of both sessions for each grader: A 1&2 and B 1&2 represent the first and second grader, respectively. The intra-observer and inter-observer comparison showed
very high correlations coefficients (cc) and U-test p-values, indicating very high linear correlation and no statistical differences both between different readers and for
the same reader at different sessions. The overlap ratios (all > 90%) and the absolute
GA area differences (all < 5%) indicate very high inter-observer and intra-observer
agreement, highlighting that the measurement and quantification of GA regions in
the generated projection images seem effective and feasible.
We evaluated the performance of the proposed segmentation algorithm in the first
dataset by comparing its results to the manual segmentation gold standard and to the
previously published QC’s method. The results obtained for four example cases are
shown in Fig. 11.23. We can observe that for these cases, the GA outlines obtained
by QC’s method slightly deviate from the gold standard boundary (expert average),
whereas the segmentation results obtained by our method seem closer to such gold
Fig. 11.21 Examples displaying the automatically segmented GA regions in SD-OCT projection
images