

11 Segmentation and Visualization of Drusen …
291
Table 11.3 Correlation coefficients (cc), paired Wilcoxon test p-values and absolute drusen area
differences between the automated segmentation method (Aut. Seg.) and gold standard (GS)
Methods
compared
Number of
eyes/drusen
present
B-scans
cc
p-value
ADAD [µm]
(mean, std)
ADAD [%]
(mean, std)
Aut.Seg.—GS 4/340
0.97
0.48
10.29 ± 8.9
15.70 ± 15.50
Aut.Seg.—GS 143/143
0.94
0.006
19.97 ± 14.68 23.77 ± 13.8
the 95% of those differences for the population of tested cases includes the 0 value
(which would indicate that the results are exactly the same). There are still differences
in the segmentation methods as indicated by the mean values, but those differences
are small when compared to the difference ranges, which also include the 0 value.
The similar mean and standard deviation values in the inter-reader and intra-reader
agreement assessment indicates that we might expect a deviation in the differences
of two manual segmentations on the same order as their mean differences, which
makes sense since they are drawn in the same set of images. The similar observed
ranges of mean and standard deviation differences between automated and manual
segmentations indicate that the automated method thus appears to closely represent
the segmentation drawn by an average user (our gold standard in this case) in the
same ranges as different readers or even the same reader at different sessions would
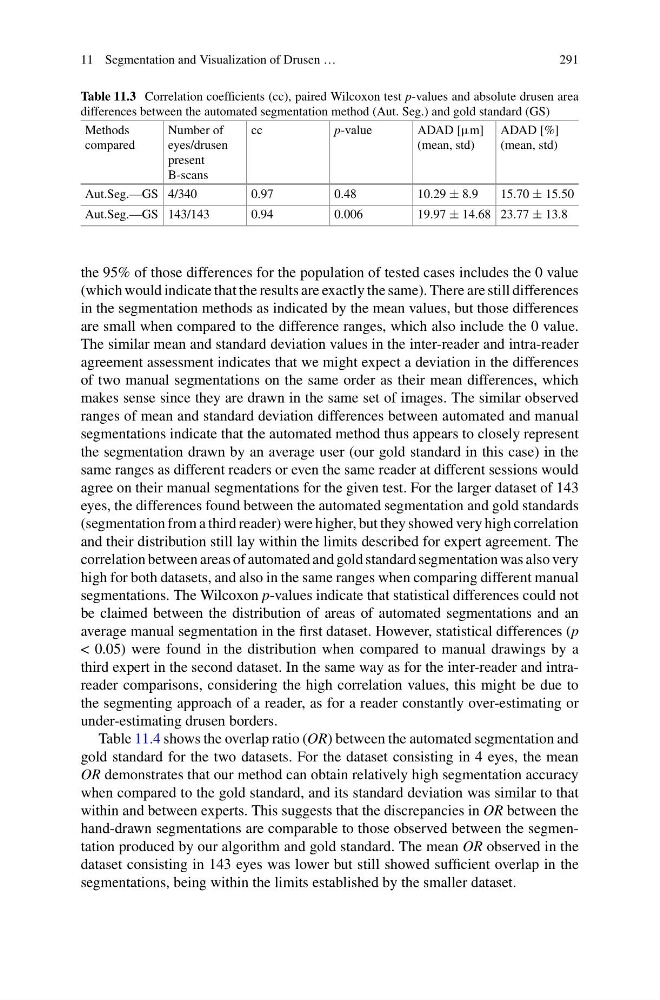
agree on their manual segmentations for the given test. For the larger dataset of 143
eyes, the differences found between the automated segmentation and gold standards
(segmentation from a third reader) were higher, but they showed very high correlation
and their distribution still lay within the limits described for expert agreement. The
correlation between areas of automated and gold standard segmentation was also very
high for both datasets, and also in the same ranges when comparing different manual
segmentations. The Wilcoxon p-values indicate that statistical differences could not
be claimed between the distribution of areas of automated segmentations and an
average manual segmentation in the first dataset. However, statistical differences (p
< 0.05) were found in the distribution when compared to manual drawings by a
third expert in the second dataset. In the same way as for the inter-reader and intrareader comparisons, considering the high correlation values, this might be due to
the segmenting approach of a reader, as for a reader constantly over-estimating or
under-estimating drusen borders.
Table 11.4 shows the overlap ratio (OR) between the automated segmentation and
gold standard for the two datasets. For the dataset consisting in 4 eyes, the mean
OR demonstrates that our method can obtain relatively high segmentation accuracy
when compared to the gold standard, and its standard deviation was similar to that
within and between experts. This suggests that the discrepancies in OR between the
hand-drawn segmentations are comparable to those observed between the segmentation produced by our algorithm and gold standard. The mean OR observed in the
dataset consisting in 143 eyes was lower but still showed sufficient overlap in the
segmentations, being within the limits established by the smaller dataset.
291
Table 11.3 Correlation coefficients (cc), paired Wilcoxon test p-values and absolute drusen area
differences between the automated segmentation method (Aut. Seg.) and gold standard (GS)
Methods
compared
Number of
eyes/drusen
present
B-scans
cc
p-value
ADAD [µm]
(mean, std)
ADAD [%]
(mean, std)
Aut.Seg.—GS 4/340
0.97
0.48
10.29 ± 8.9
15.70 ± 15.50
Aut.Seg.—GS 143/143
0.94
0.006
19.97 ± 14.68 23.77 ± 13.8
the 95% of those differences for the population of tested cases includes the 0 value
(which would indicate that the results are exactly the same). There are still differences
in the segmentation methods as indicated by the mean values, but those differences
are small when compared to the difference ranges, which also include the 0 value.
The similar mean and standard deviation values in the inter-reader and intra-reader
agreement assessment indicates that we might expect a deviation in the differences
of two manual segmentations on the same order as their mean differences, which
makes sense since they are drawn in the same set of images. The similar observed
ranges of mean and standard deviation differences between automated and manual
segmentations indicate that the automated method thus appears to closely represent
the segmentation drawn by an average user (our gold standard in this case) in the
same ranges as different readers or even the same reader at different sessions would
agree on their manual segmentations for the given test. For the larger dataset of 143
eyes, the differences found between the automated segmentation and gold standards
(segmentation from a third reader) were higher, but they showed very high correlation
and their distribution still lay within the limits described for expert agreement. The
correlation between areas of automated and gold standard segmentation was also very
high for both datasets, and also in the same ranges when comparing different manual
segmentations. The Wilcoxon p-values indicate that statistical differences could not
be claimed between the distribution of areas of automated segmentations and an
average manual segmentation in the first dataset. However, statistical differences (p
< 0.05) were found in the distribution when compared to manual drawings by a
third expert in the second dataset. In the same way as for the inter-reader and intrareader comparisons, considering the high correlation values, this might be due to
the segmenting approach of a reader, as for a reader constantly over-estimating or
under-estimating drusen borders.
Table 11.4 shows the overlap ratio (OR) between the automated segmentation and
gold standard for the two datasets. For the dataset consisting in 4 eyes, the mean
OR demonstrates that our method can obtain relatively high segmentation accuracy
when compared to the gold standard, and its standard deviation was similar to that
within and between experts. This suggests that the discrepancies in OR between the
hand-drawn segmentations are comparable to those observed between the segmentation produced by our algorithm and gold standard. The mean OR observed in the
dataset consisting in 143 eyes was lower but still showed sufficient overlap in the
segmentations, being within the limits established by the smaller dataset.