

290
Q. Chen et al.
Table 11.1 Within-expert and between-expert correlation coefficients (cc), paired Wilcoxon test
p-values and mean absolute drusen area differences
Methods compared
Number of
eyes/drusen
present B-scans
cc
p-value ADAD
[µm]
(mean, std)
ADAD [%]
(mean, std)
Expert A 1 —Expert A 2
4/340
0.97
0.0001 8.33 ± 9.50 12.38 ± 16.55
Expert B 1 —Expert B 2
4/340
0.98
0.73
9.64 ± 6.53 14.41 ± 12.24
ExpertA 1&2 —ExpertB 1&2 4/680
0.97
0.013
9.98 ± 9.49 14.17 ± 14.54
Table 11.2 Overlap ratio evaluation between the manual segmentations
Methods compared
Number of eyes/drusen
present B-scans
Overlap ratio [%]
(mean, std)
Expert A 1 —Expert A 2
4/340
81.08 ± 10.46
Expert B 1 —Expert B 2
4/340
80.73 ± 8.73
Expert A 1&2 —Expert B 1&2
4/680
79.24 ± 9.65
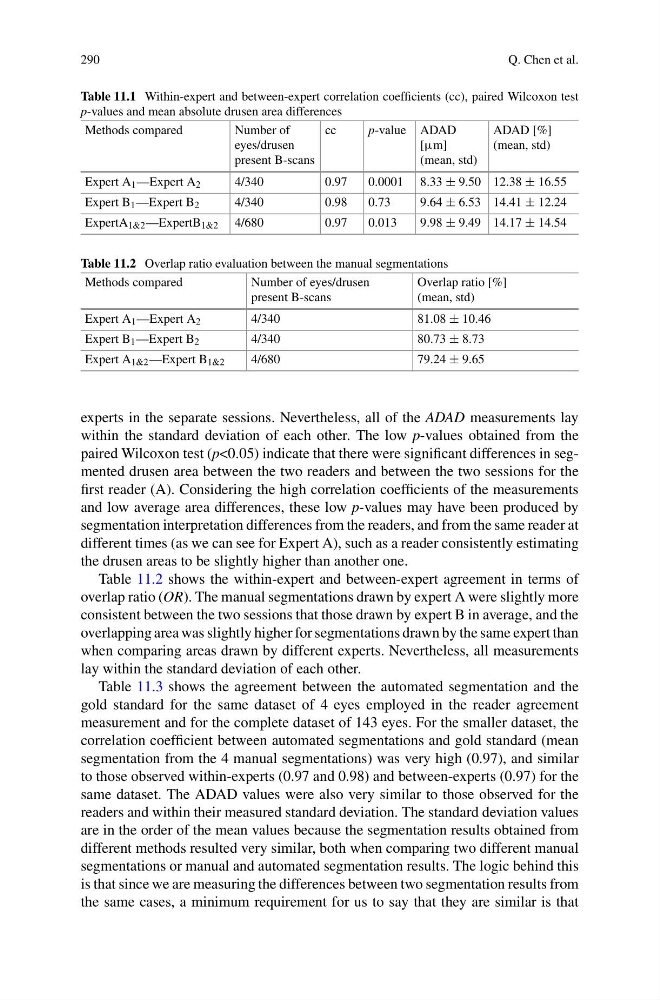
experts in the separate sessions. Nevertheless, all of the ADAD measurements lay
within the standard deviation of each other. The low p-values obtained from the
paired Wilcoxon test (p<0.05) indicate that there were significant differences in segmented drusen area between the two readers and between the two sessions for the
first reader (A). Considering the high correlation coefficients of the measurements
and low average area differences, these low p-values may have been produced by
segmentation interpretation differences from the readers, and from the same reader at
different times (as we can see for Expert A), such as a reader consistently estimating
the drusen areas to be slightly higher than another one.
Table 11.2 shows the within-expert and between-expert agreement in terms of
overlap ratio (OR). The manual segmentations drawn by expert A were slightly more
consistent between the two sessions that those drawn by expert B in average, and the
overlapping area was slightly higher for segmentations drawn by the same expert than
when comparing areas drawn by different experts. Nevertheless, all measurements
lay within the standard deviation of each other.
Table 11.3 shows the agreement between the automated segmentation and the
gold standard for the same dataset of 4 eyes employed in the reader agreement
measurement and for the complete dataset of 143 eyes. For the smaller dataset, the
correlation coefficient between automated segmentations and gold standard (mean
segmentation from the 4 manual segmentations) was very high (0.97), and similar
to those observed within-experts (0.97 and 0.98) and between-experts (0.97) for the
same dataset. The ADAD values were also very similar to those observed for the
readers and within their measured standard deviation. The standard deviation values
are in the order of the mean values because the segmentation results obtained from
different methods resulted very similar, both when comparing two different manual
segmentations or manual and automated segmentation results. The logic behind this
is that since we are measuring the differences between two segmentation results from
the same cases, a minimum requirement for us to say that they are similar is that
Q. Chen et al.
Table 11.1 Within-expert and between-expert correlation coefficients (cc), paired Wilcoxon test
p-values and mean absolute drusen area differences
Methods compared
Number of
eyes/drusen
present B-scans
cc
p-value ADAD
[µm]
(mean, std)
ADAD [%]
(mean, std)
Expert A 1 —Expert A 2
4/340
0.97
0.0001 8.33 ± 9.50 12.38 ± 16.55
Expert B 1 —Expert B 2
4/340
0.98
0.73
9.64 ± 6.53 14.41 ± 12.24
ExpertA 1&2 —ExpertB 1&2 4/680
0.97
0.013
9.98 ± 9.49 14.17 ± 14.54
Table 11.2 Overlap ratio evaluation between the manual segmentations
Methods compared
Number of eyes/drusen
present B-scans
Overlap ratio [%]
(mean, std)
Expert A 1 —Expert A 2
4/340
81.08 ± 10.46
Expert B 1 —Expert B 2
4/340
80.73 ± 8.73
Expert A 1&2 —Expert B 1&2
4/680
79.24 ± 9.65
experts in the separate sessions. Nevertheless, all of the ADAD measurements lay
within the standard deviation of each other. The low p-values obtained from the
paired Wilcoxon test (p<0.05) indicate that there were significant differences in segmented drusen area between the two readers and between the two sessions for the
first reader (A). Considering the high correlation coefficients of the measurements
and low average area differences, these low p-values may have been produced by
segmentation interpretation differences from the readers, and from the same reader at
different times (as we can see for Expert A), such as a reader consistently estimating
the drusen areas to be slightly higher than another one.
Table 11.2 shows the within-expert and between-expert agreement in terms of
overlap ratio (OR). The manual segmentations drawn by expert A were slightly more
consistent between the two sessions that those drawn by expert B in average, and the
overlapping area was slightly higher for segmentations drawn by the same expert than
when comparing areas drawn by different experts. Nevertheless, all measurements
lay within the standard deviation of each other.
Table 11.3 shows the agreement between the automated segmentation and the
gold standard for the same dataset of 4 eyes employed in the reader agreement
measurement and for the complete dataset of 143 eyes. For the smaller dataset, the
correlation coefficient between automated segmentations and gold standard (mean
segmentation from the 4 manual segmentations) was very high (0.97), and similar
to those observed within-experts (0.97 and 0.98) and between-experts (0.97) for the
same dataset. The ADAD values were also very similar to those observed for the
readers and within their measured standard deviation. The standard deviation values
are in the order of the mean values because the segmentation results obtained from
different methods resulted very similar, both when comparing two different manual
segmentations or manual and automated segmentation results. The logic behind this
is that since we are measuring the differences between two segmentation results from
the same cases, a minimum requirement for us to say that they are similar is that