

11 Segmentation and Visualization of Drusen …
289
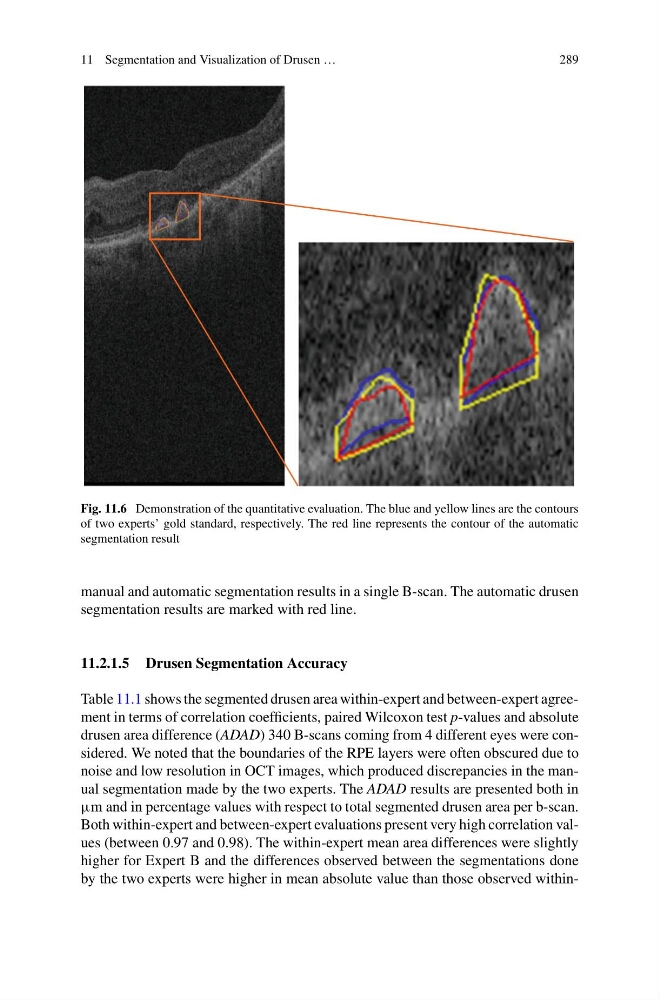
Fig. 11.6 Demonstration of the quantitative evaluation. The blue and yellow lines are the contours
of two experts’ gold standard, respectively. The red line represents the contour of the automatic
segmentation result
manual and automatic segmentation results in a single B-scan. The automatic drusen
segmentation results are marked with red line.
11.2.1.5 Drusen Segmentation Accuracy
Table 11.1 shows the segmented drusen area within-expert and between-expert agreement in terms of correlation coefficients, paired Wilcoxon test p-values and absolute
drusen area difference (ADAD) 340 B-scans coming from 4 different eyes were considered. We noted that the boundaries of the RPE layers were often obscured due to
noise and low resolution in OCT images, which produced discrepancies in the manual segmentation made by the two experts. The ADAD results are presented both in
µm and in percentage values with respect to total segmented drusen area per b-scan.
Both within-expert and between-expert evaluations present very high correlation values (between 0.97 and 0.98). The within-expert mean area differences were slightly
higher for Expert B and the differences observed between the segmentations done
by the two experts were higher in mean absolute value than those observed within-
289
Fig. 11.6 Demonstration of the quantitative evaluation. The blue and yellow lines are the contours
of two experts’ gold standard, respectively. The red line represents the contour of the automatic
segmentation result
manual and automatic segmentation results in a single B-scan. The automatic drusen
segmentation results are marked with red line.
11.2.1.5 Drusen Segmentation Accuracy
Table 11.1 shows the segmented drusen area within-expert and between-expert agreement in terms of correlation coefficients, paired Wilcoxon test p-values and absolute
drusen area difference (ADAD) 340 B-scans coming from 4 different eyes were considered. We noted that the boundaries of the RPE layers were often obscured due to
noise and low resolution in OCT images, which produced discrepancies in the manual segmentation made by the two experts. The ADAD results are presented both in
µm and in percentage values with respect to total segmented drusen area per b-scan.
Both within-expert and between-expert evaluations present very high correlation values (between 0.97 and 0.98). The within-expert mean area differences were slightly
higher for Expert B and the differences observed between the segmentations done
by the two experts were higher in mean absolute value than those observed within-