

288
Q. Chen et al.
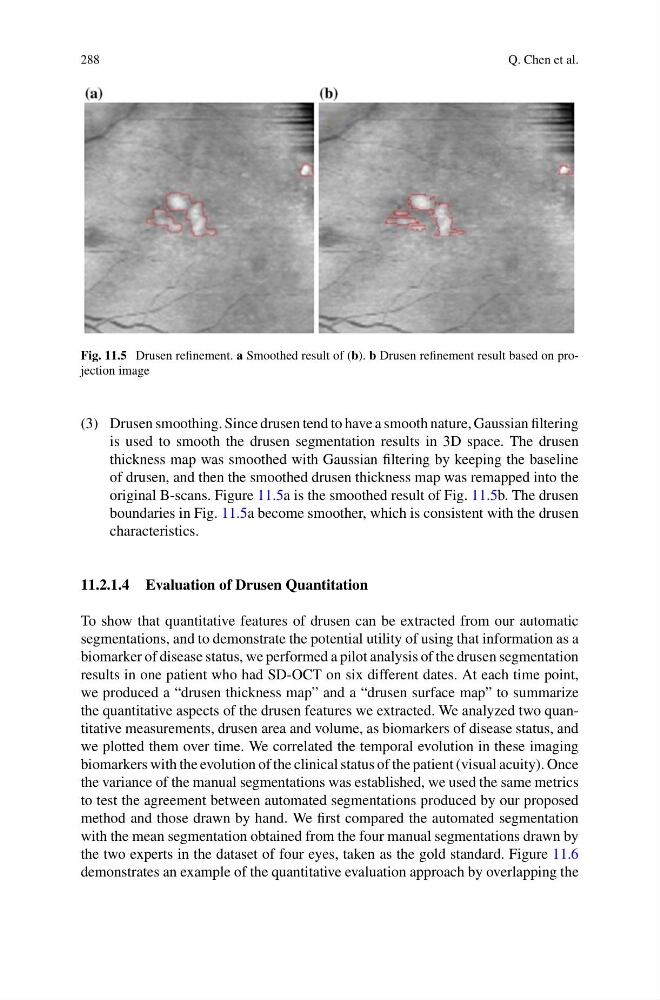
Fig. 11.5 Drusen refinement. a Smoothed result of (b). b Drusen refinement result based on projection image
(3) Drusen smoothing. Since drusen tend to have a smooth nature, Gaussian filtering
is used to smooth the drusen segmentation results in 3D space. The drusen
thickness map was smoothed with Gaussian filtering by keeping the baseline
of drusen, and then the smoothed drusen thickness map was remapped into the
original B-scans. Figure 11.5a is the smoothed result of Fig. 11.5b. The drusen
boundaries in Fig. 11.5a become smoother, which is consistent with the drusen
characteristics.
11.2.1.4 Evaluation of Drusen Quantitation
To show that quantitative features of drusen can be extracted from our automatic
segmentations, and to demonstrate the potential utility of using that information as a
biomarker of disease status, we performed a pilot analysis of the drusen segmentation
results in one patient who had SD-OCT on six different dates. At each time point,
we produced a “drusen thickness map” and a “drusen surface map” to summarize
the quantitative aspects of the drusen features we extracted. We analyzed two quantitative measurements, drusen area and volume, as biomarkers of disease status, and
we plotted them over time. We correlated the temporal evolution in these imaging
biomarkers with the evolution of the clinical status of the patient (visual acuity). Once
the variance of the manual segmentations was established, we used the same metrics
to test the agreement between automated segmentations produced by our proposed
method and those drawn by hand. We first compared the automated segmentation
with the mean segmentation obtained from the four manual segmentations drawn by
the two experts in the dataset of four eyes, taken as the gold standard. Figure 11.6
demonstrates an example of the quantitative evaluation approach by overlapping the
Q. Chen et al.
Fig. 11.5 Drusen refinement. a Smoothed result of (b). b Drusen refinement result based on projection image
(3) Drusen smoothing. Since drusen tend to have a smooth nature, Gaussian filtering
is used to smooth the drusen segmentation results in 3D space. The drusen
thickness map was smoothed with Gaussian filtering by keeping the baseline
of drusen, and then the smoothed drusen thickness map was remapped into the
original B-scans. Figure 11.5a is the smoothed result of Fig. 11.5b. The drusen
boundaries in Fig. 11.5a become smoother, which is consistent with the drusen
characteristics.
11.2.1.4 Evaluation of Drusen Quantitation
To show that quantitative features of drusen can be extracted from our automatic
segmentations, and to demonstrate the potential utility of using that information as a
biomarker of disease status, we performed a pilot analysis of the drusen segmentation
results in one patient who had SD-OCT on six different dates. At each time point,
we produced a “drusen thickness map” and a “drusen surface map” to summarize
the quantitative aspects of the drusen features we extracted. We analyzed two quantitative measurements, drusen area and volume, as biomarkers of disease status, and
we plotted them over time. We correlated the temporal evolution in these imaging
biomarkers with the evolution of the clinical status of the patient (visual acuity). Once
the variance of the manual segmentations was established, we used the same metrics
to test the agreement between automated segmentations produced by our proposed
method and those drawn by hand. We first compared the automated segmentation
with the mean segmentation obtained from the four manual segmentations drawn by
the two experts in the dataset of four eyes, taken as the gold standard. Figure 11.6
demonstrates an example of the quantitative evaluation approach by overlapping the