

292
Q. Chen et al.
Table 11.4 Overlap ratio evaluation between the automated segmentation method (Aut. Seg.) and
gold standard (GS)
Methods compared
Number of eyes/drusen
present B-scans
Overlap ratio [%] (mean, std)
Aut. Seg.—GS
4/340
76.33 ± 11.29
Aut. Seg.—GS
143/143
67.18 ± 9.14
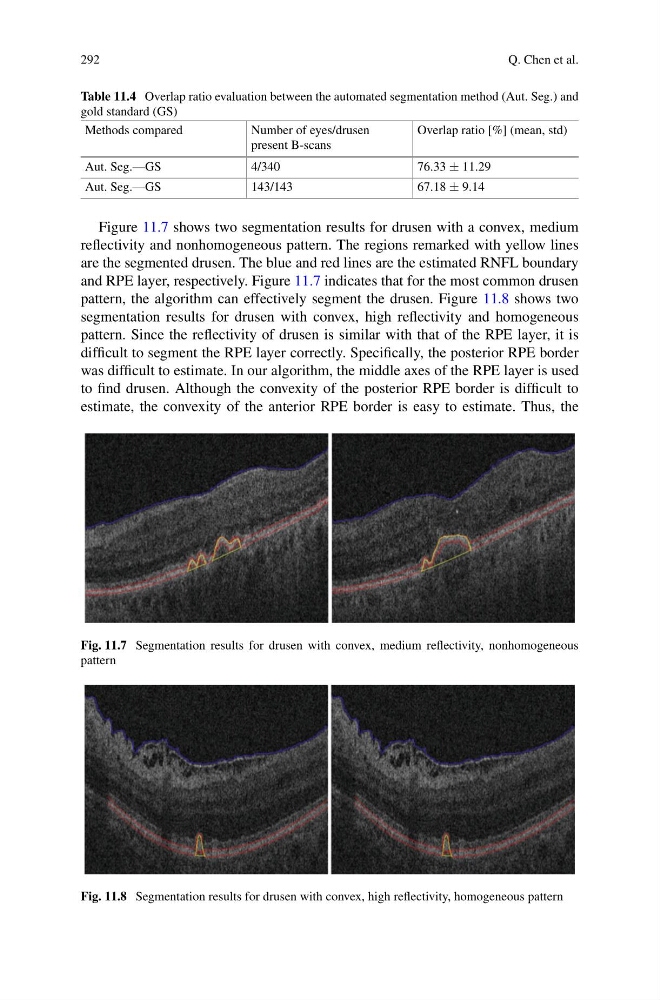
Figure 11.7 shows two segmentation results for drusen with a convex, medium
reflectivity and nonhomogeneous pattern. The regions remarked with yellow lines
are the segmented drusen. The blue and red lines are the estimated RNFL boundary
and RPE layer, respectively. Figure 11.7 indicates that for the most common drusen
pattern, the algorithm can effectively segment the drusen. Figure 11.8 shows two
segmentation results for drusen with convex, high reflectivity and homogeneous
pattern. Since the reflectivity of drusen is similar with that of the RPE layer, it is
difficult to segment the RPE layer correctly. Specifically, the posterior RPE border
was difficult to estimate. In our algorithm, the middle axes of the RPE layer is used
to find drusen. Although the convexity of the posterior RPE border is difficult to
estimate, the convexity of the anterior RPE border is easy to estimate. Thus, the
Fig. 11.7 Segmentation results for drusen with convex, medium reflectivity, nonhomogeneous
pattern
Fig. 11.8 Segmentation results for drusen with convex, high reflectivity, homogeneous pattern
Q. Chen et al.
Table 11.4 Overlap ratio evaluation between the automated segmentation method (Aut. Seg.) and
gold standard (GS)
Methods compared
Number of eyes/drusen
present B-scans
Overlap ratio [%] (mean, std)
Aut. Seg.—GS
4/340
76.33 ± 11.29
Aut. Seg.—GS
143/143
67.18 ± 9.14
Figure 11.7 shows two segmentation results for drusen with a convex, medium
reflectivity and nonhomogeneous pattern. The regions remarked with yellow lines
are the segmented drusen. The blue and red lines are the estimated RNFL boundary
and RPE layer, respectively. Figure 11.7 indicates that for the most common drusen
pattern, the algorithm can effectively segment the drusen. Figure 11.8 shows two
segmentation results for drusen with convex, high reflectivity and homogeneous
pattern. Since the reflectivity of drusen is similar with that of the RPE layer, it is
difficult to segment the RPE layer correctly. Specifically, the posterior RPE border
was difficult to estimate. In our algorithm, the middle axes of the RPE layer is used
to find drusen. Although the convexity of the posterior RPE border is difficult to
estimate, the convexity of the anterior RPE border is easy to estimate. Thus, the
Fig. 11.7 Segmentation results for drusen with convex, medium reflectivity, nonhomogeneous
pattern
Fig. 11.8 Segmentation results for drusen with convex, high reflectivity, homogeneous pattern