

286
Q. Chen et al.
RNFL
complex
(a)
(b)
(c)
Vitreous
RNFL
IS/OS
RPE
Choroid
Druse
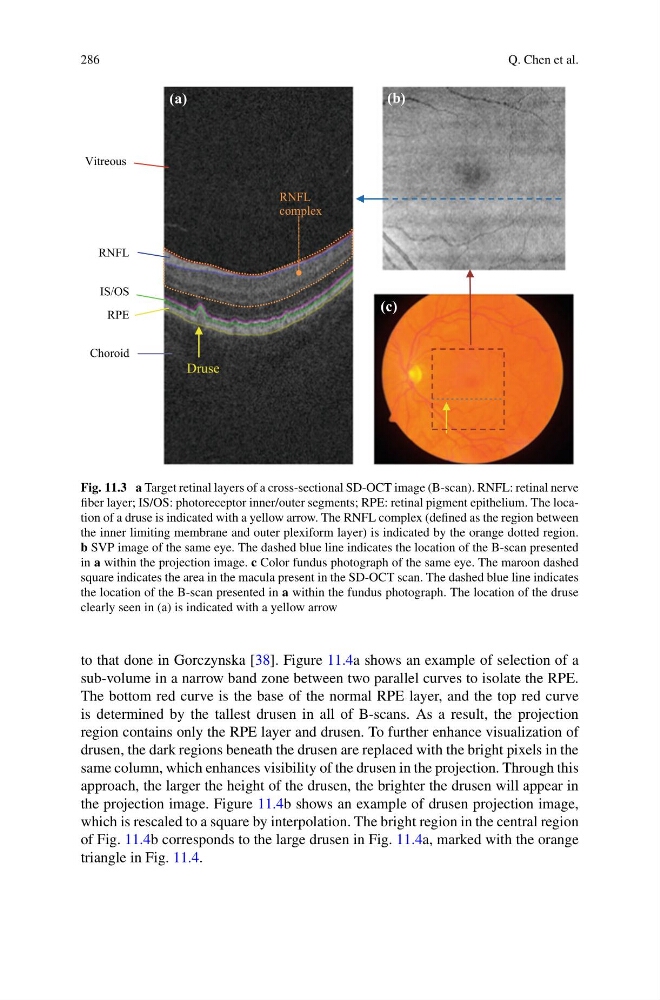
Fig. 11.3 a Target retinal layers of a cross-sectional SD-OCT image (B-scan). RNFL: retinal nerve
fiber layer; IS/OS: photoreceptor inner/outer segments; RPE: retinal pigment epithelium. The location of a druse is indicated with a yellow arrow. The RNFL complex (defined as the region between
the inner limiting membrane and outer plexiform layer) is indicated by the orange dotted region.
b SVP image of the same eye. The dashed blue line indicates the location of the B-scan presented
in a within the projection image. c Color fundus photograph of the same eye. The maroon dashed
square indicates the area in the macula present in the SD-OCT scan. The dashed blue line indicates
the location of the B-scan presented in a within the fundus photograph. The location of the druse
clearly seen in (a) is indicated with a yellow arrow
to that done in Gorczynska [38]. Figure 11.4a shows an example of selection of a
sub-volume in a narrow band zone between two parallel curves to isolate the RPE.
The bottom red curve is the base of the normal RPE layer, and the top red curve
is determined by the tallest drusen in all of B-scans. As a result, the projection
region contains only the RPE layer and drusen. To further enhance visualization of
drusen, the dark regions beneath the drusen are replaced with the bright pixels in the
same column, which enhances visibility of the drusen in the projection. Through this
approach, the larger the height of the drusen, the brighter the drusen will appear in
the projection image. Figure 11.4b shows an example of drusen projection image,
which is rescaled to a square by interpolation. The bright region in the central region
of Fig. 11.4b corresponds to the large drusen in Fig. 11.4a, marked with the orange
triangle in Fig. 11.4.
Q. Chen et al.
RNFL
complex
(a)
(b)
(c)
Vitreous
RNFL
IS/OS
RPE
Choroid
Druse
Fig. 11.3 a Target retinal layers of a cross-sectional SD-OCT image (B-scan). RNFL: retinal nerve
fiber layer; IS/OS: photoreceptor inner/outer segments; RPE: retinal pigment epithelium. The location of a druse is indicated with a yellow arrow. The RNFL complex (defined as the region between
the inner limiting membrane and outer plexiform layer) is indicated by the orange dotted region.
b SVP image of the same eye. The dashed blue line indicates the location of the B-scan presented
in a within the projection image. c Color fundus photograph of the same eye. The maroon dashed
square indicates the area in the macula present in the SD-OCT scan. The dashed blue line indicates
the location of the B-scan presented in a within the fundus photograph. The location of the druse
clearly seen in (a) is indicated with a yellow arrow
to that done in Gorczynska [38]. Figure 11.4a shows an example of selection of a
sub-volume in a narrow band zone between two parallel curves to isolate the RPE.
The bottom red curve is the base of the normal RPE layer, and the top red curve
is determined by the tallest drusen in all of B-scans. As a result, the projection
region contains only the RPE layer and drusen. To further enhance visualization of
drusen, the dark regions beneath the drusen are replaced with the bright pixels in the
same column, which enhances visibility of the drusen in the projection. Through this
approach, the larger the height of the drusen, the brighter the drusen will appear in
the projection image. Figure 11.4b shows an example of drusen projection image,
which is rescaled to a square by interpolation. The bright region in the central region
of Fig. 11.4b corresponds to the large drusen in Fig. 11.4a, marked with the orange
triangle in Fig. 11.4.