

10 Layer Segmentation and Analysis for Retina with Diseases
273
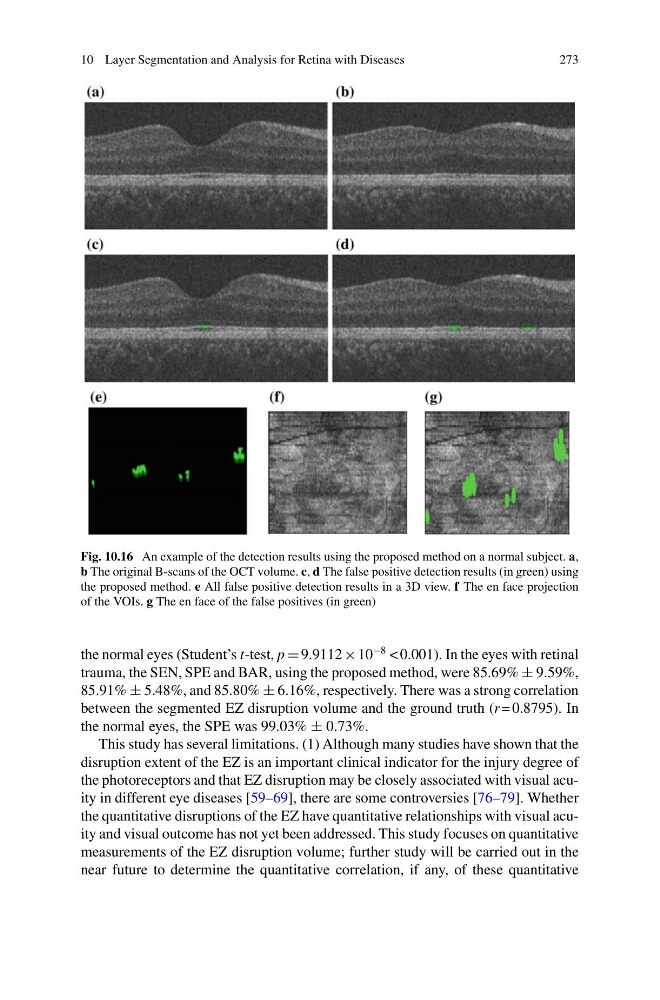
Fig. 10.16 An example of the detection results using the proposed method on a normal subject. a,
b The original B-scans of the OCT volume. c, d The false positive detection results (in green) using
the proposed method. e All false positive detection results in a 3D view. f The en face projection
of the VOIs. g The en face of the false positives (in green)
the normal eyes (Student’s t-test, p 9.9112 × 10
−8 < 0.001). In the eyes with retinal
trauma, the SEN, SPE and BAR, using the proposed method, were 85.69% ± 9.59%,
85.91% ± 5.48%, and 85.80% ± 6.16%, respectively. There was a strong correlation
between the segmented EZ disruption volume and the ground truth (r = 0.8795). In
the normal eyes, the SPE was 99.03% ± 0.73%.
This study has several limitations. (1) Although many studies have shown that the
disruption extent of the EZ is an important clinical indicator for the injury degree of
the photoreceptors and that EZ disruption may be closely associated with visual acuity in different eye diseases [59–69], there are some controversies [76–79]. Whether
the quantitative disruptions of the EZ have quantitative relationships with visual acuity and visual outcome has not yet been addressed. This study focuses on quantitative
measurements of the EZ disruption volume; further study will be carried out in the
near future to determine the quantitative correlation, if any, of these quantitative
273
Fig. 10.16 An example of the detection results using the proposed method on a normal subject. a,
b The original B-scans of the OCT volume. c, d The false positive detection results (in green) using
the proposed method. e All false positive detection results in a 3D view. f The en face projection
of the VOIs. g The en face of the false positives (in green)
the normal eyes (Student’s t-test, p 9.9112 × 10
−8 < 0.001). In the eyes with retinal
trauma, the SEN, SPE and BAR, using the proposed method, were 85.69% ± 9.59%,
85.91% ± 5.48%, and 85.80% ± 6.16%, respectively. There was a strong correlation
between the segmented EZ disruption volume and the ground truth (r = 0.8795). In
the normal eyes, the SPE was 99.03% ± 0.73%.
This study has several limitations. (1) Although many studies have shown that the
disruption extent of the EZ is an important clinical indicator for the injury degree of
the photoreceptors and that EZ disruption may be closely associated with visual acuity in different eye diseases [59–69], there are some controversies [76–79]. Whether
the quantitative disruptions of the EZ have quantitative relationships with visual acuity and visual outcome has not yet been addressed. This study focuses on quantitative
measurements of the EZ disruption volume; further study will be carried out in the
near future to determine the quantitative correlation, if any, of these quantitative