

272
F. Shi et al.
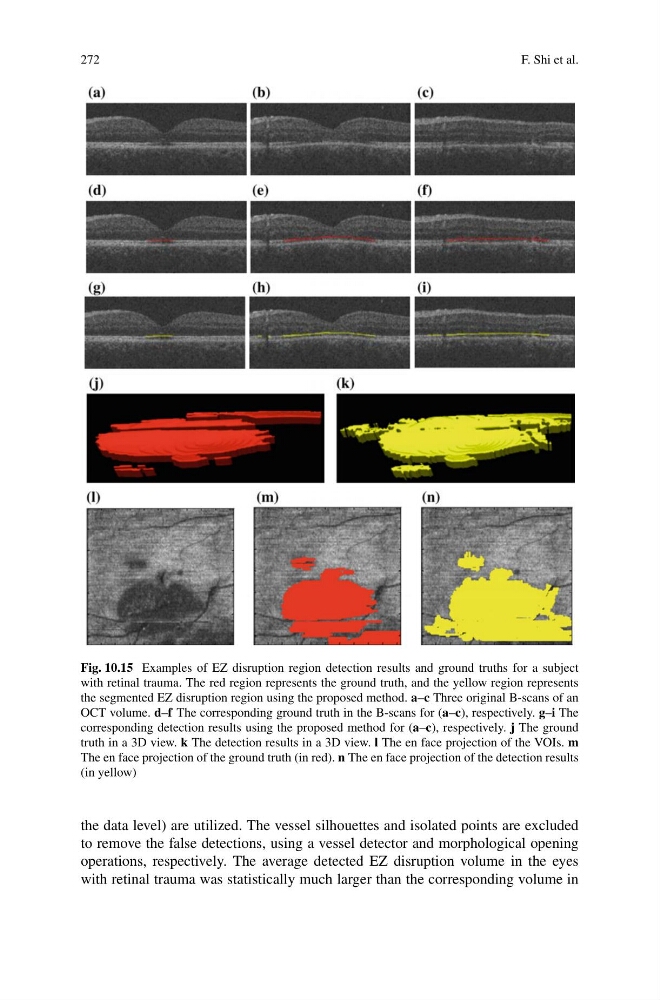
Fig. 10.15 Examples of EZ disruption region detection results and ground truths for a subject
with retinal trauma. The red region represents the ground truth, and the yellow region represents
the segmented EZ disruption region using the proposed method. a–c Three original B-scans of an
OCT volume. d–f The corresponding ground truth in the B-scans for (a–c), respectively. g–i The
corresponding detection results using the proposed method for (a–c), respectively. j The ground
truth in a 3D view. k The detection results in a 3D view. l The en face projection of the VOIs. m
The en face projection of the ground truth (in red). n The en face projection of the detection results
(in yellow)
the data level) are utilized. The vessel silhouettes and isolated points are excluded
to remove the false detections, using a vessel detector and morphological opening
operations, respectively. The average detected EZ disruption volume in the eyes
with retinal trauma was statistically much larger than the corresponding volume in
F. Shi et al.
Fig. 10.15 Examples of EZ disruption region detection results and ground truths for a subject
with retinal trauma. The red region represents the ground truth, and the yellow region represents
the segmented EZ disruption region using the proposed method. a–c Three original B-scans of an
OCT volume. d–f The corresponding ground truth in the B-scans for (a–c), respectively. g–i The
corresponding detection results using the proposed method for (a–c), respectively. j The ground
truth in a 3D view. k The detection results in a 3D view. l The en face projection of the VOIs. m
The en face projection of the ground truth (in red). n The en face projection of the detection results
(in yellow)
the data level) are utilized. The vessel silhouettes and isolated points are excluded
to remove the false detections, using a vessel detector and morphological opening
operations, respectively. The average detected EZ disruption volume in the eyes
with retinal trauma was statistically much larger than the corresponding volume in