

274
F. Shi et al.
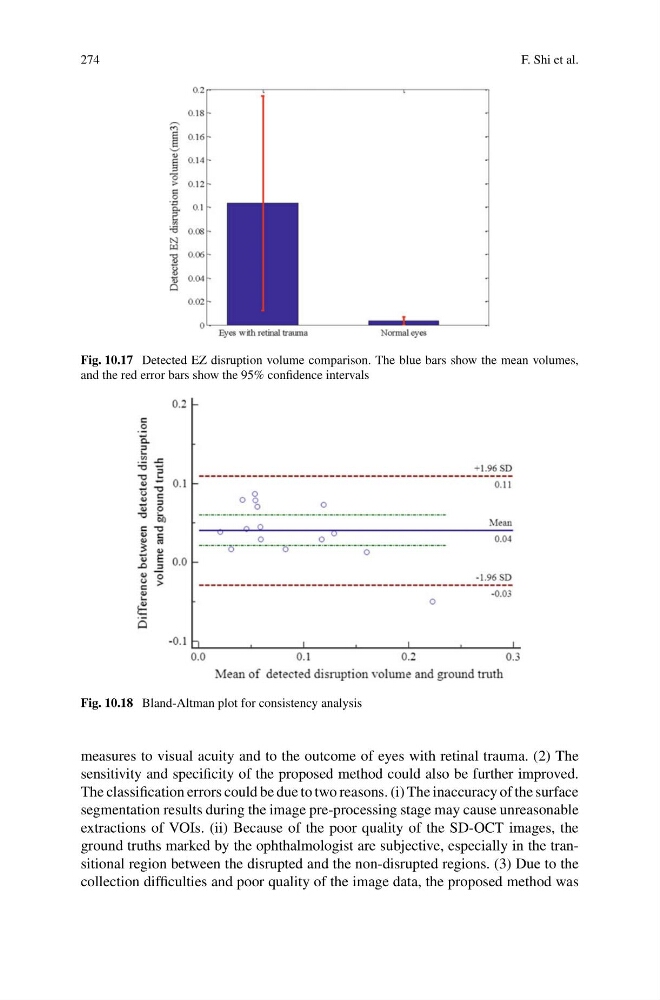
Fig. 10.17 Detected EZ disruption volume comparison. The blue bars show the mean volumes,
and the red error bars show the 95% confidence intervals
Fig. 10.18 Bland-Altman plot for consistency analysis
measures to visual acuity and to the outcome of eyes with retinal trauma. (2) The
sensitivity and specificity of the proposed method could also be further improved.
The classification errors could be due to two reasons. (i) The inaccuracy of the surface
segmentation results during the image pre-processing stage may cause unreasonable
extractions of VOIs. (ii) Because of the poor quality of the SD-OCT images, the
ground truths marked by the ophthalmologist are subjective, especially in the transitional region between the disrupted and the non-disrupted regions. (3) Due to the
collection difficulties and poor quality of the image data, the proposed method was
F. Shi et al.
Fig. 10.17 Detected EZ disruption volume comparison. The blue bars show the mean volumes,
and the red error bars show the 95% confidence intervals
Fig. 10.18 Bland-Altman plot for consistency analysis
measures to visual acuity and to the outcome of eyes with retinal trauma. (2) The
sensitivity and specificity of the proposed method could also be further improved.
The classification errors could be due to two reasons. (i) The inaccuracy of the surface
segmentation results during the image pre-processing stage may cause unreasonable
extractions of VOIs. (ii) Because of the poor quality of the SD-OCT images, the
ground truths marked by the ophthalmologist are subjective, especially in the transitional region between the disrupted and the non-disrupted regions. (3) Due to the
collection difficulties and poor quality of the image data, the proposed method was