

10 Layer Segmentation and Analysis for Retina with Diseases
263
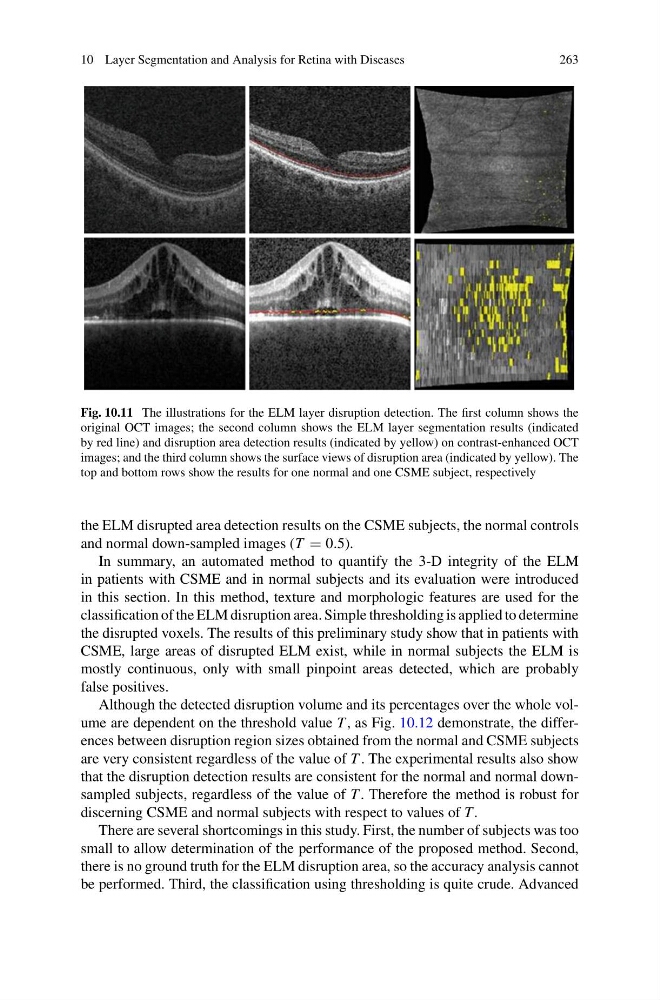
Fig. 10.11 The illustrations for the ELM layer disruption detection. The first column shows the
original OCT images; the second column shows the ELM layer segmentation results (indicated
by red line) and disruption area detection results (indicated by yellow) on contrast-enhanced OCT
images; and the third column shows the surface views of disruption area (indicated by yellow). The
top and bottom rows show the results for one normal and one CSME subject, respectively
the ELM disrupted area detection results on the CSME subjects, the normal controls
and normal down-sampled images (T 0.5).
In summary, an automated method to quantify the 3-D integrity of the ELM
in patients with CSME and in normal subjects and its evaluation were introduced
in this section. In this method, texture and morphologic features are used for the
classification of the ELM disruption area. Simple thresholding is applied to determine
the disrupted voxels. The results of this preliminary study show that in patients with
CSME, large areas of disrupted ELM exist, while in normal subjects the ELM is
mostly continuous, only with small pinpoint areas detected, which are probably
false positives.
Although the detected disruption volume and its percentages over the whole volume are dependent on the threshold value T , as Fig. 10.12 demonstrate, the differences between disruption region sizes obtained from the normal and CSME subjects
are very consistent regardless of the value of T . The experimental results also show
that the disruption detection results are consistent for the normal and normal downsampled subjects, regardless of the value of T . Therefore the method is robust for
discerning CSME and normal subjects with respect to values of T .
There are several shortcomings in this study. First, the number of subjects was too
small to allow determination of the performance of the proposed method. Second,
there is no ground truth for the ELM disruption area, so the accuracy analysis cannot
be performed. Third, the classification using thresholding is quite crude. Advanced
263
Fig. 10.11 The illustrations for the ELM layer disruption detection. The first column shows the
original OCT images; the second column shows the ELM layer segmentation results (indicated
by red line) and disruption area detection results (indicated by yellow) on contrast-enhanced OCT
images; and the third column shows the surface views of disruption area (indicated by yellow). The
top and bottom rows show the results for one normal and one CSME subject, respectively
the ELM disrupted area detection results on the CSME subjects, the normal controls
and normal down-sampled images (T 0.5).
In summary, an automated method to quantify the 3-D integrity of the ELM
in patients with CSME and in normal subjects and its evaluation were introduced
in this section. In this method, texture and morphologic features are used for the
classification of the ELM disruption area. Simple thresholding is applied to determine
the disrupted voxels. The results of this preliminary study show that in patients with
CSME, large areas of disrupted ELM exist, while in normal subjects the ELM is
mostly continuous, only with small pinpoint areas detected, which are probably
false positives.
Although the detected disruption volume and its percentages over the whole volume are dependent on the threshold value T , as Fig. 10.12 demonstrate, the differences between disruption region sizes obtained from the normal and CSME subjects
are very consistent regardless of the value of T . The experimental results also show
that the disruption detection results are consistent for the normal and normal downsampled subjects, regardless of the value of T . Therefore the method is robust for
discerning CSME and normal subjects with respect to values of T .
There are several shortcomings in this study. First, the number of subjects was too
small to allow determination of the performance of the proposed method. Second,
there is no ground truth for the ELM disruption area, so the accuracy analysis cannot
be performed. Third, the classification using thresholding is quite crude. Advanced