

262
F. Shi et al.
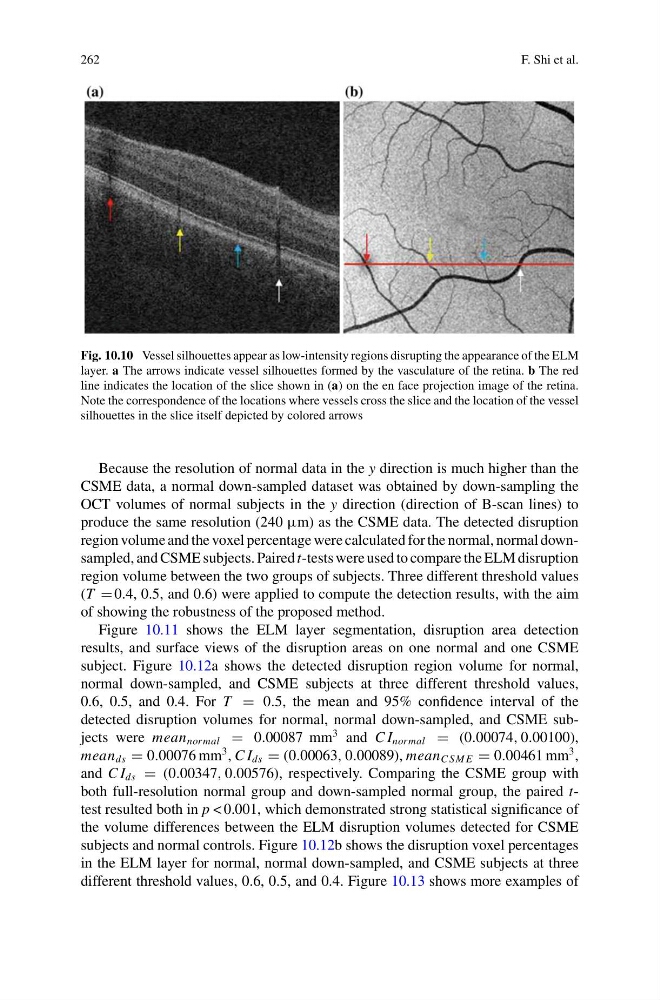
Fig. 10.10 Vessel silhouettes appear as low-intensity regions disrupting the appearance of the ELM
layer. a The arrows indicate vessel silhouettes formed by the vasculature of the retina. b The red
line indicates the location of the slice shown in (a) on the en face projection image of the retina.
Note the correspondence of the locations where vessels cross the slice and the location of the vessel
silhouettes in the slice itself depicted by colored arrows
Because the resolution of normal data in the y direction is much higher than the
CSME data, a normal down-sampled dataset was obtained by down-sampling the
OCT volumes of normal subjects in the y direction (direction of B-scan lines) to
produce the same resolution (240 µm) as the CSME data. The detected disruption
region volume and the voxel percentage were calculated for the normal, normal downsampled, and CSME subjects. Paired t-tests were used to compare the ELM disruption
region volume between the two groups of subjects. Three different threshold values
(T 0.4, 0.5, and 0.6) were applied to compute the detection results, with the aim
of showing the robustness of the proposed method.
Figure 10.11 shows the ELM layer segmentation, disruption area detection
results, and surface views of the disruption areas on one normal and one CSME
subject. Figure 10.12a shows the detected disruption region volume for normal,
normal down-sampled, and CSME subjects at three different threshold values,
0.6, 0.5, and 0.4. For T 0.5, the mean and 95% confidence interval of the
detected disruption volumes for normal, normal down-sampled, and CSME subjects were mean normal 0.00087 mm
3 and C I normal (0.00074, 0.00100),
mean ds 0.00076 mm
3 , C I ds (0.00063, 0.00089), mean C SM E 0.00461 mm
3 ,
and C I ds (0.00347, 0.00576), respectively. Comparing the CSME group with
both full-resolution normal group and down-sampled normal group, the paired ttest resulted both in p < 0.001, which demonstrated strong statistical significance of
the volume differences between the ELM disruption volumes detected for CSME
subjects and normal controls. Figure 10.12b shows the disruption voxel percentages
in the ELM layer for normal, normal down-sampled, and CSME subjects at three
different threshold values, 0.6, 0.5, and 0.4. Figure 10.13 shows more examples of
F. Shi et al.
Fig. 10.10 Vessel silhouettes appear as low-intensity regions disrupting the appearance of the ELM
layer. a The arrows indicate vessel silhouettes formed by the vasculature of the retina. b The red
line indicates the location of the slice shown in (a) on the en face projection image of the retina.
Note the correspondence of the locations where vessels cross the slice and the location of the vessel
silhouettes in the slice itself depicted by colored arrows
Because the resolution of normal data in the y direction is much higher than the
CSME data, a normal down-sampled dataset was obtained by down-sampling the
OCT volumes of normal subjects in the y direction (direction of B-scan lines) to
produce the same resolution (240 µm) as the CSME data. The detected disruption
region volume and the voxel percentage were calculated for the normal, normal downsampled, and CSME subjects. Paired t-tests were used to compare the ELM disruption
region volume between the two groups of subjects. Three different threshold values
(T 0.4, 0.5, and 0.6) were applied to compute the detection results, with the aim
of showing the robustness of the proposed method.
Figure 10.11 shows the ELM layer segmentation, disruption area detection
results, and surface views of the disruption areas on one normal and one CSME
subject. Figure 10.12a shows the detected disruption region volume for normal,
normal down-sampled, and CSME subjects at three different threshold values,
0.6, 0.5, and 0.4. For T 0.5, the mean and 95% confidence interval of the
detected disruption volumes for normal, normal down-sampled, and CSME subjects were mean normal 0.00087 mm
3 and C I normal (0.00074, 0.00100),
mean ds 0.00076 mm
3 , C I ds (0.00063, 0.00089), mean C SM E 0.00461 mm
3 ,
and C I ds (0.00347, 0.00576), respectively. Comparing the CSME group with
both full-resolution normal group and down-sampled normal group, the paired ttest resulted both in p < 0.001, which demonstrated strong statistical significance of
the volume differences between the ELM disruption volumes detected for CSME
subjects and normal controls. Figure 10.12b shows the disruption voxel percentages
in the ELM layer for normal, normal down-sampled, and CSME subjects at three
different threshold values, 0.6, 0.5, and 0.4. Figure 10.13 shows more examples of