

10 Layer Segmentation and Analysis for Retina with Diseases
261
P orientation (x)
1 if center voxel
s intensity > two end voxels
intensity
0 otherwise
(10.7)
P coherence (x)
y∈region x
δ(I y , μ I − σ I )
N
where δ(a, b)
1 if a < b
0 otherwise
(10.8)
P thickness (x) exp
−
thickness max − thickness x
σ T
(10.9)
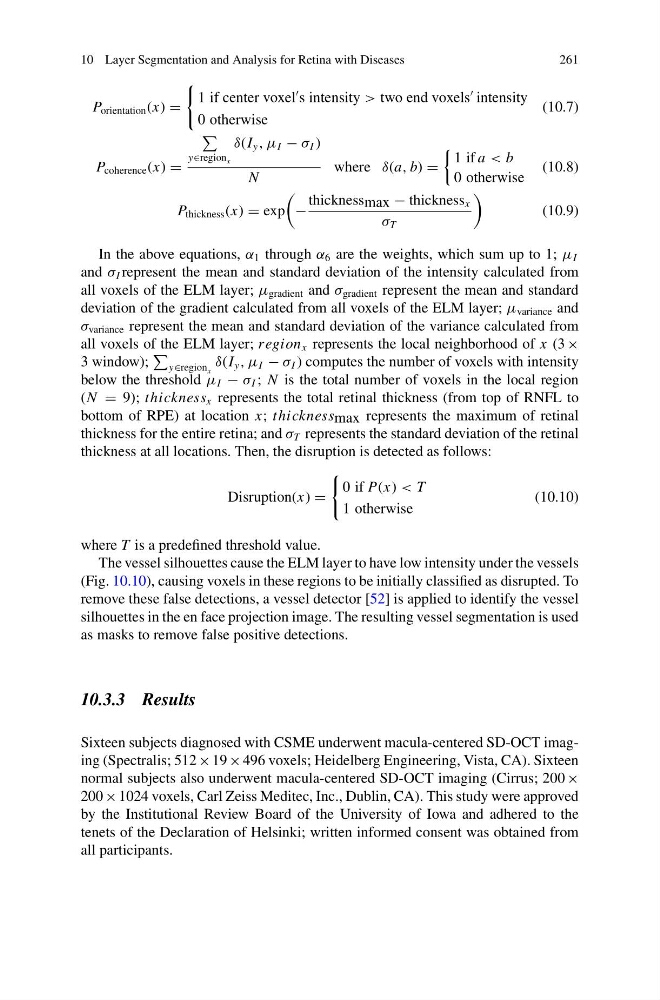
In the above equations, α 1 through α 6 are the weights, which sum up to 1; μ I
and σ I represent the mean and standard deviation of the intensity calculated from
all voxels of the ELM layer; μ gradient and σ gradient represent the mean and standard
deviation of the gradient calculated from all voxels of the ELM layer; μ variance and
σ variance represent the mean and standard deviation of the variance calculated from
all voxels of the ELM layer; region x represents the local neighborhood of x (3 ×
3 window);
y∈region x
δ(I y , μ I − σ I ) computes the number of voxels with intensity
below the threshold μ I − σ I ; N is the total number of voxels in the local region
(N 9); thickness x represents the total retinal thickness (from top of RNFL to
bottom of RPE) at location x; thickness max represents the maximum of retinal
thickness for the entire retina; and σ T represents the standard deviation of the retinal
thickness at all locations. Then, the disruption is detected as follows:
Disruption(x)
0 if P(x) < T
1 otherwise
(10.10)
where T is a predefined threshold value.
The vessel silhouettes cause the ELM layer to have low intensity under the vessels
(Fig. 10.10), causing voxels in these regions to be initially classified as disrupted. To
remove these false detections, a vessel detector [52] is applied to identify the vessel
silhouettes in the en face projection image. The resulting vessel segmentation is used
as masks to remove false positive detections.
10.3.3 Results
Sixteen subjects diagnosed with CSME underwent macula-centered SD-OCT imaging (Spectralis; 512 × 19 × 496 voxels; Heidelberg Engineering, Vista, CA). Sixteen
normal subjects also underwent macula-centered SD-OCT imaging (Cirrus; 200 ×
200 × 1024 voxels, Carl Zeiss Meditec, Inc., Dublin, CA). This study were approved
by the Institutional Review Board of the University of Iowa and adhered to the
tenets of the Declaration of Helsinki; written informed consent was obtained from
all participants.
261
P orientation (x)
1 if center voxel
s intensity > two end voxels
intensity
0 otherwise
(10.7)
P coherence (x)
y∈region x
δ(I y , μ I − σ I )
N
where δ(a, b)
1 if a < b
0 otherwise
(10.8)
P thickness (x) exp
−
thickness max − thickness x
σ T
(10.9)
In the above equations, α 1 through α 6 are the weights, which sum up to 1; μ I
and σ I represent the mean and standard deviation of the intensity calculated from
all voxels of the ELM layer; μ gradient and σ gradient represent the mean and standard
deviation of the gradient calculated from all voxels of the ELM layer; μ variance and
σ variance represent the mean and standard deviation of the variance calculated from
all voxels of the ELM layer; region x represents the local neighborhood of x (3 ×
3 window);
y∈region x
δ(I y , μ I − σ I ) computes the number of voxels with intensity
below the threshold μ I − σ I ; N is the total number of voxels in the local region
(N 9); thickness x represents the total retinal thickness (from top of RNFL to
bottom of RPE) at location x; thickness max represents the maximum of retinal
thickness for the entire retina; and σ T represents the standard deviation of the retinal
thickness at all locations. Then, the disruption is detected as follows:
Disruption(x)
0 if P(x) < T
1 otherwise
(10.10)
where T is a predefined threshold value.
The vessel silhouettes cause the ELM layer to have low intensity under the vessels
(Fig. 10.10), causing voxels in these regions to be initially classified as disrupted. To
remove these false detections, a vessel detector [52] is applied to identify the vessel
silhouettes in the en face projection image. The resulting vessel segmentation is used
as masks to remove false positive detections.
10.3.3 Results
Sixteen subjects diagnosed with CSME underwent macula-centered SD-OCT imaging (Spectralis; 512 × 19 × 496 voxels; Heidelberg Engineering, Vista, CA). Sixteen
normal subjects also underwent macula-centered SD-OCT imaging (Cirrus; 200 ×
200 × 1024 voxels, Carl Zeiss Meditec, Inc., Dublin, CA). This study were approved
by the Institutional Review Board of the University of Iowa and adhered to the
tenets of the Declaration of Helsinki; written informed consent was obtained from
all participants.