

252
F. Shi et al.
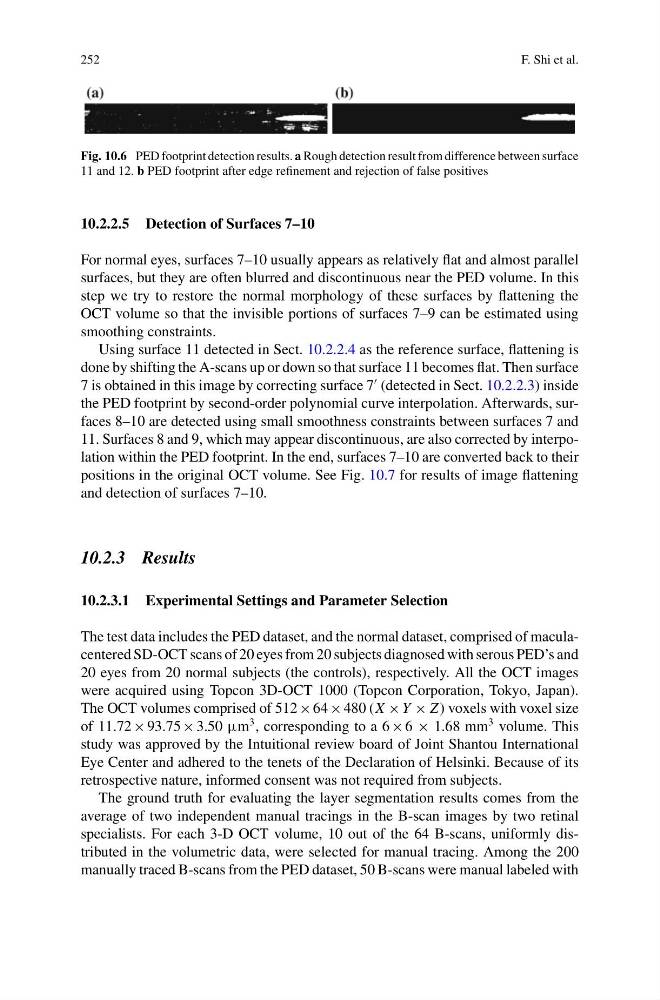
Fig. 10.6 PED footprint detection results. a Rough detection result from difference between surface
11 and 12. b PED footprint after edge refinement and rejection of false positives
10.2.2.5 Detection of Surfaces 7–10
For normal eyes, surfaces 7–10 usually appears as relatively flat and almost parallel
surfaces, but they are often blurred and discontinuous near the PED volume. In this
step we try to restore the normal morphology of these surfaces by flattening the
OCT volume so that the invisible portions of surfaces 7–9 can be estimated using
smoothing constraints.
Using surface 11 detected in Sect. 10.2.2.4 as the reference surface, flattening is
done by shifting the A-scans up or down so that surface 11 becomes flat. Then surface
7 is obtained in this image by correcting surface 7
(detected in Sect. 10.2.2.3) inside
the PED footprint by second-order polynomial curve interpolation. Afterwards, surfaces 8–10 are detected using small smoothness constraints between surfaces 7 and
11. Surfaces 8 and 9, which may appear discontinuous, are also corrected by interpolation within the PED footprint. In the end, surfaces 7–10 are converted back to their
positions in the original OCT volume. See Fig. 10.7 for results of image flattening
and detection of surfaces 7–10.
10.2.3 Results
10.2.3.1 Experimental Settings and Parameter Selection
The test data includes the PED dataset, and the normal dataset, comprised of maculacentered SD-OCT scans of 20 eyes from 20 subjects diagnosed with serous PED’s and
20 eyes from 20 normal subjects (the controls), respectively. All the OCT images
were acquired using Topcon 3D-OCT 1000 (Topcon Corporation, Tokyo, Japan).
The OCT volumes comprised of 512 × 64 × 480 (X × Y × Z ) voxels with voxel size
of 11.72 × 93.75 × 3.50 µm
3 , corresponding to a 6 × 6 × 1.68 mm
3 volume. This
study was approved by the Intuitional review board of Joint Shantou International
Eye Center and adhered to the tenets of the Declaration of Helsinki. Because of its
retrospective nature, informed consent was not required from subjects.
The ground truth for evaluating the layer segmentation results comes from the
average of two independent manual tracings in the B-scan images by two retinal
specialists. For each 3-D OCT volume, 10 out of the 64 B-scans, uniformly distributed in the volumetric data, were selected for manual tracing. Among the 200
manually traced B-scans from the PED dataset, 50 B-scans were manual labeled with
F. Shi et al.
Fig. 10.6 PED footprint detection results. a Rough detection result from difference between surface
11 and 12. b PED footprint after edge refinement and rejection of false positives
10.2.2.5 Detection of Surfaces 7–10
For normal eyes, surfaces 7–10 usually appears as relatively flat and almost parallel
surfaces, but they are often blurred and discontinuous near the PED volume. In this
step we try to restore the normal morphology of these surfaces by flattening the
OCT volume so that the invisible portions of surfaces 7–9 can be estimated using
smoothing constraints.
Using surface 11 detected in Sect. 10.2.2.4 as the reference surface, flattening is
done by shifting the A-scans up or down so that surface 11 becomes flat. Then surface
7 is obtained in this image by correcting surface 7
(detected in Sect. 10.2.2.3) inside
the PED footprint by second-order polynomial curve interpolation. Afterwards, surfaces 8–10 are detected using small smoothness constraints between surfaces 7 and
11. Surfaces 8 and 9, which may appear discontinuous, are also corrected by interpolation within the PED footprint. In the end, surfaces 7–10 are converted back to their
positions in the original OCT volume. See Fig. 10.7 for results of image flattening
and detection of surfaces 7–10.
10.2.3 Results
10.2.3.1 Experimental Settings and Parameter Selection
The test data includes the PED dataset, and the normal dataset, comprised of maculacentered SD-OCT scans of 20 eyes from 20 subjects diagnosed with serous PED’s and
20 eyes from 20 normal subjects (the controls), respectively. All the OCT images
were acquired using Topcon 3D-OCT 1000 (Topcon Corporation, Tokyo, Japan).
The OCT volumes comprised of 512 × 64 × 480 (X × Y × Z ) voxels with voxel size
of 11.72 × 93.75 × 3.50 µm
3 , corresponding to a 6 × 6 × 1.68 mm
3 volume. This
study was approved by the Intuitional review board of Joint Shantou International
Eye Center and adhered to the tenets of the Declaration of Helsinki. Because of its
retrospective nature, informed consent was not required from subjects.
The ground truth for evaluating the layer segmentation results comes from the
average of two independent manual tracings in the B-scan images by two retinal
specialists. For each 3-D OCT volume, 10 out of the 64 B-scans, uniformly distributed in the volumetric data, were selected for manual tracing. Among the 200
manually traced B-scans from the PED dataset, 50 B-scans were manual labeled with