

10 Layer Segmentation and Analysis for Retina with Diseases
253
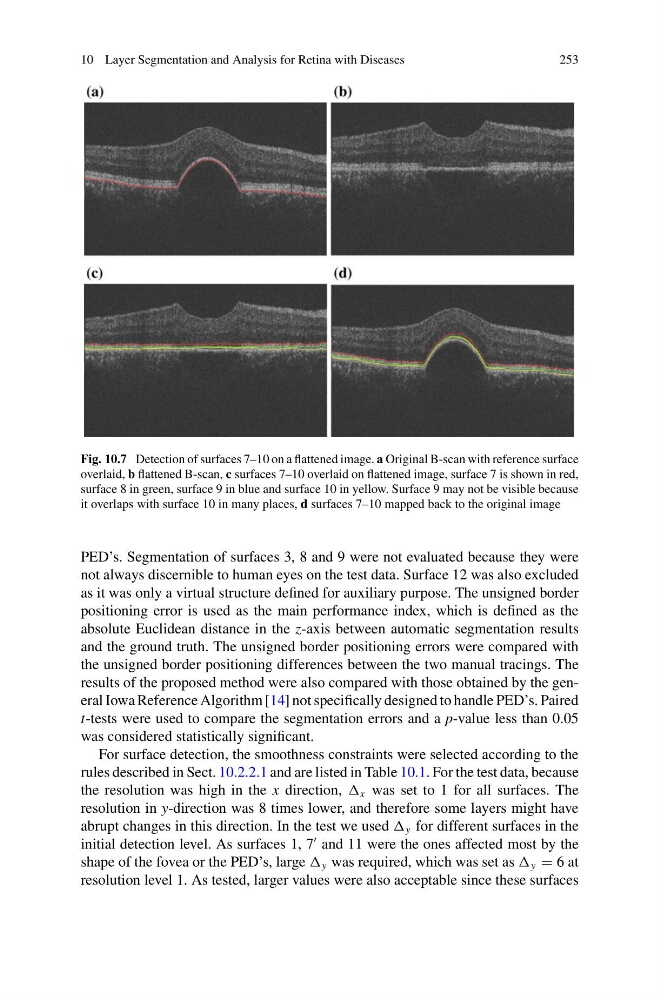
Fig. 10.7 Detection of surfaces 7–10 on a flattened image. a Original B-scan with reference surface
overlaid, b flattened B-scan, c surfaces 7–10 overlaid on flattened image, surface 7 is shown in red,
surface 8 in green, surface 9 in blue and surface 10 in yellow. Surface 9 may not be visible because
it overlaps with surface 10 in many places, d surfaces 7–10 mapped back to the original image
PED’s. Segmentation of surfaces 3, 8 and 9 were not evaluated because they were
not always discernible to human eyes on the test data. Surface 12 was also excluded
as it was only a virtual structure defined for auxiliary purpose. The unsigned border
positioning error is used as the main performance index, which is defined as the
absolute Euclidean distance in the z-axis between automatic segmentation results
and the ground truth. The unsigned border positioning errors were compared with
the unsigned border positioning differences between the two manual tracings. The
results of the proposed method were also compared with those obtained by the general Iowa Reference Algorithm [14] not specifically designed to handle PED’s. Paired
t-tests were used to compare the segmentation errors and a p-value less than 0.05
was considered statistically significant.
For surface detection, the smoothness constraints were selected according to the
rules described in Sect. 10.2.2.1 and are listed in Table 10.1. For the test data, because
the resolution was high in the x direction, x was set to 1 for all surfaces. The
resolution in y-direction was 8 times lower, and therefore some layers might have
abrupt changes in this direction. In the test we used y for different surfaces in the
initial detection level. As surfaces 1, 7
and 11 were the ones affected most by the
shape of the fovea or the PED’s, large y was required, which was set as y 6 at
resolution level 1. As tested, larger values were also acceptable since these surfaces
253
Fig. 10.7 Detection of surfaces 7–10 on a flattened image. a Original B-scan with reference surface
overlaid, b flattened B-scan, c surfaces 7–10 overlaid on flattened image, surface 7 is shown in red,
surface 8 in green, surface 9 in blue and surface 10 in yellow. Surface 9 may not be visible because
it overlaps with surface 10 in many places, d surfaces 7–10 mapped back to the original image
PED’s. Segmentation of surfaces 3, 8 and 9 were not evaluated because they were
not always discernible to human eyes on the test data. Surface 12 was also excluded
as it was only a virtual structure defined for auxiliary purpose. The unsigned border
positioning error is used as the main performance index, which is defined as the
absolute Euclidean distance in the z-axis between automatic segmentation results
and the ground truth. The unsigned border positioning errors were compared with
the unsigned border positioning differences between the two manual tracings. The
results of the proposed method were also compared with those obtained by the general Iowa Reference Algorithm [14] not specifically designed to handle PED’s. Paired
t-tests were used to compare the segmentation errors and a p-value less than 0.05
was considered statistically significant.
For surface detection, the smoothness constraints were selected according to the
rules described in Sect. 10.2.2.1 and are listed in Table 10.1. For the test data, because
the resolution was high in the x direction, x was set to 1 for all surfaces. The
resolution in y-direction was 8 times lower, and therefore some layers might have
abrupt changes in this direction. In the test we used y for different surfaces in the
initial detection level. As surfaces 1, 7
and 11 were the ones affected most by the
shape of the fovea or the PED’s, large y was required, which was set as y 6 at
resolution level 1. As tested, larger values were also acceptable since these surfaces