

10 Layer Segmentation and Analysis for Retina with Diseases
251
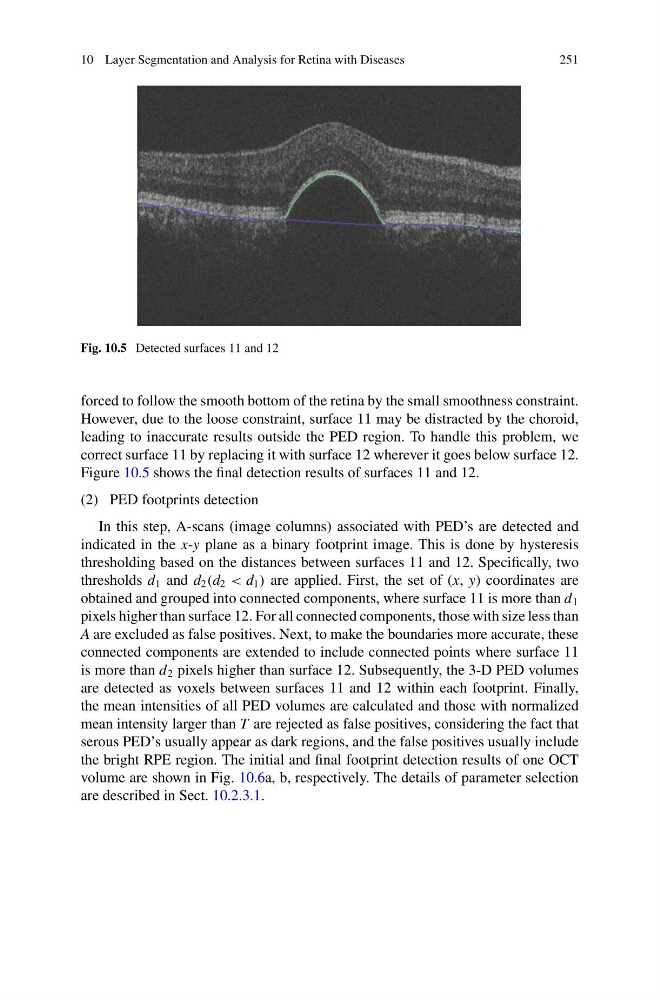
Fig. 10.5 Detected surfaces 11 and 12
forced to follow the smooth bottom of the retina by the small smoothness constraint.
However, due to the loose constraint, surface 11 may be distracted by the choroid,
leading to inaccurate results outside the PED region. To handle this problem, we
correct surface 11 by replacing it with surface 12 wherever it goes below surface 12.
Figure 10.5 shows the final detection results of surfaces 11 and 12.
(2) PED footprints detection
In this step, A-scans (image columns) associated with PED’s are detected and
indicated in the x-y plane as a binary footprint image. This is done by hysteresis
thresholding based on the distances between surfaces 11 and 12. Specifically, two
thresholds d 1 and d 2 (d 2 < d 1 ) are applied. First, the set of (x, y) coordinates are
obtained and grouped into connected components, where surface 11 is more than d 1
pixels higher than surface 12. For all connected components, those with size less than
A are excluded as false positives. Next, to make the boundaries more accurate, these
connected components are extended to include connected points where surface 11
is more than d 2 pixels higher than surface 12. Subsequently, the 3-D PED volumes
are detected as voxels between surfaces 11 and 12 within each footprint. Finally,
the mean intensities of all PED volumes are calculated and those with normalized
mean intensity larger than T are rejected as false positives, considering the fact that
serous PED’s usually appear as dark regions, and the false positives usually include
the bright RPE region. The initial and final footprint detection results of one OCT
volume are shown in Fig. 10.6a, b, respectively. The details of parameter selection
are described in Sect. 10.2.3.1.
251
Fig. 10.5 Detected surfaces 11 and 12
forced to follow the smooth bottom of the retina by the small smoothness constraint.
However, due to the loose constraint, surface 11 may be distracted by the choroid,
leading to inaccurate results outside the PED region. To handle this problem, we
correct surface 11 by replacing it with surface 12 wherever it goes below surface 12.
Figure 10.5 shows the final detection results of surfaces 11 and 12.
(2) PED footprints detection
In this step, A-scans (image columns) associated with PED’s are detected and
indicated in the x-y plane as a binary footprint image. This is done by hysteresis
thresholding based on the distances between surfaces 11 and 12. Specifically, two
thresholds d 1 and d 2 (d 2 < d 1 ) are applied. First, the set of (x, y) coordinates are
obtained and grouped into connected components, where surface 11 is more than d 1
pixels higher than surface 12. For all connected components, those with size less than
A are excluded as false positives. Next, to make the boundaries more accurate, these
connected components are extended to include connected points where surface 11
is more than d 2 pixels higher than surface 12. Subsequently, the 3-D PED volumes
are detected as voxels between surfaces 11 and 12 within each footprint. Finally,
the mean intensities of all PED volumes are calculated and those with normalized
mean intensity larger than T are rejected as false positives, considering the fact that
serous PED’s usually appear as dark regions, and the false positives usually include
the bright RPE region. The initial and final footprint detection results of one OCT
volume are shown in Fig. 10.6a, b, respectively. The details of parameter selection
are described in Sect. 10.2.3.1.