

234
K. K. Vupparaboina et al.
9.3.2 Methodology
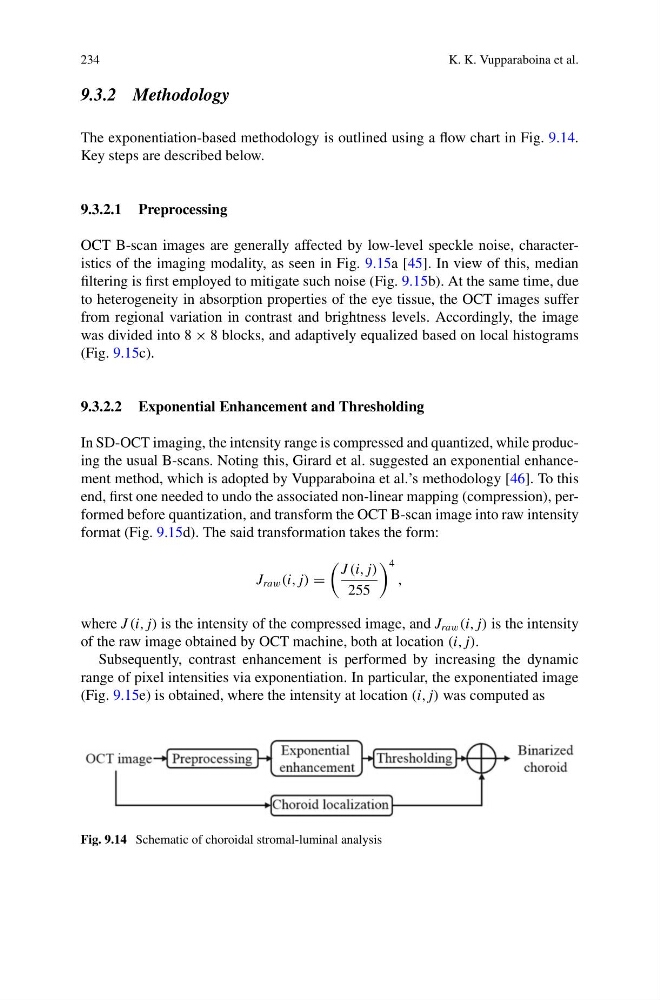
The exponentiation-based methodology is outlined using a flow chart in Fig. 9.14.
Key steps are described below.
9.3.2.1 Preprocessing
OCT B-scan images are generally affected by low-level speckle noise, characteristics of the imaging modality, as seen in Fig. 9.15a [45]. In view of this, median
filtering is first employed to mitigate such noise (Fig. 9.15b). At the same time, due
to heterogeneity in absorption properties of the eye tissue, the OCT images suffer
from regional variation in contrast and brightness levels. Accordingly, the image
was divided into 8 × 8 blocks, and adaptively equalized based on local histograms
(Fig. 9.15c).
9.3.2.2 Exponential Enhancement and Thresholding
In SD-OCT imaging, the intensity range is compressed and quantized, while producing the usual B-scans. Noting this, Girard et al. suggested an exponential enhancement method, which is adopted by Vupparaboina et al.’s methodology [46]. To this
end, first one needed to undo the associated non-linear mapping (compression), performed before quantization, and transform the OCT B-scan image into raw intensity
format (Fig. 9.15d). The said transformation takes the form:
J raw (i, j) =
J (i, j)
255
4
,
where J (i, j) is the intensity of the compressed image, and J raw (i, j) is the intensity
of the raw image obtained by OCT machine, both at location (i, j).
Subsequently, contrast enhancement is performed by increasing the dynamic
range of pixel intensities via exponentiation. In particular, the exponentiated image
(Fig. 9.15e) is obtained, where the intensity at location (i, j) was computed as
Fig. 9.14 Schematic of choroidal stromal-luminal analysis
K. K. Vupparaboina et al.
9.3.2 Methodology
The exponentiation-based methodology is outlined using a flow chart in Fig. 9.14.
Key steps are described below.
9.3.2.1 Preprocessing
OCT B-scan images are generally affected by low-level speckle noise, characteristics of the imaging modality, as seen in Fig. 9.15a [45]. In view of this, median
filtering is first employed to mitigate such noise (Fig. 9.15b). At the same time, due
to heterogeneity in absorption properties of the eye tissue, the OCT images suffer
from regional variation in contrast and brightness levels. Accordingly, the image
was divided into 8 × 8 blocks, and adaptively equalized based on local histograms
(Fig. 9.15c).
9.3.2.2 Exponential Enhancement and Thresholding
In SD-OCT imaging, the intensity range is compressed and quantized, while producing the usual B-scans. Noting this, Girard et al. suggested an exponential enhancement method, which is adopted by Vupparaboina et al.’s methodology [46]. To this
end, first one needed to undo the associated non-linear mapping (compression), performed before quantization, and transform the OCT B-scan image into raw intensity
format (Fig. 9.15d). The said transformation takes the form:
J raw (i, j) =
J (i, j)
255
4
,
where J (i, j) is the intensity of the compressed image, and J raw (i, j) is the intensity
of the raw image obtained by OCT machine, both at location (i, j).
Subsequently, contrast enhancement is performed by increasing the dynamic
range of pixel intensities via exponentiation. In particular, the exponentiated image
(Fig. 9.15e) is obtained, where the intensity at location (i, j) was computed as
Fig. 9.14 Schematic of choroidal stromal-luminal analysis