

9 Choroidal OCT Analytics
233
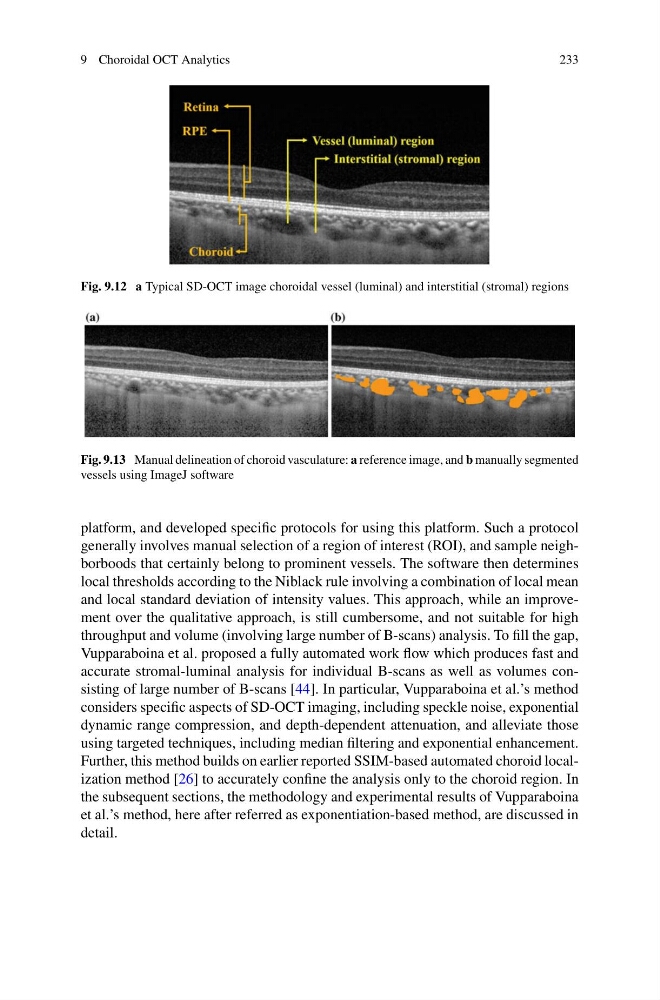
Fig. 9.12 a Typical SD-OCT image choroidal vessel (luminal) and interstitial (stromal) regions
Fig. 9.13 Manual delineation of choroid vasculature: a reference image, and b manually segmented
vessels using ImageJ software
platform, and developed specific protocols for using this platform. Such a protocol
generally involves manual selection of a region of interest (ROI), and sample neighborboods that certainly belong to prominent vessels. The software then determines
local thresholds according to the Niblack rule involving a combination of local mean
and local standard deviation of intensity values. This approach, while an improvement over the qualitative approach, is still cumbersome, and not suitable for high
throughput and volume (involving large number of B-scans) analysis. To fill the gap,
Vupparaboina et al. proposed a fully automated work flow which produces fast and
accurate stromal-luminal analysis for individual B-scans as well as volumes consisting of large number of B-scans [44]. In particular, Vupparaboina et al.’s method
considers specific aspects of SD-OCT imaging, including speckle noise, exponential
dynamic range compression, and depth-dependent attenuation, and alleviate those
using targeted techniques, including median filtering and exponential enhancement.
Further, this method builds on earlier reported SSIM-based automated choroid localization method [26] to accurately confine the analysis only to the choroid region. In
the subsequent sections, the methodology and experimental results of Vupparaboina
et al.’s method, here after referred as exponentiation-based method, are discussed in
detail.
233
Fig. 9.12 a Typical SD-OCT image choroidal vessel (luminal) and interstitial (stromal) regions
Fig. 9.13 Manual delineation of choroid vasculature: a reference image, and b manually segmented
vessels using ImageJ software
platform, and developed specific protocols for using this platform. Such a protocol
generally involves manual selection of a region of interest (ROI), and sample neighborboods that certainly belong to prominent vessels. The software then determines
local thresholds according to the Niblack rule involving a combination of local mean
and local standard deviation of intensity values. This approach, while an improvement over the qualitative approach, is still cumbersome, and not suitable for high
throughput and volume (involving large number of B-scans) analysis. To fill the gap,
Vupparaboina et al. proposed a fully automated work flow which produces fast and
accurate stromal-luminal analysis for individual B-scans as well as volumes consisting of large number of B-scans [44]. In particular, Vupparaboina et al.’s method
considers specific aspects of SD-OCT imaging, including speckle noise, exponential
dynamic range compression, and depth-dependent attenuation, and alleviate those
using targeted techniques, including median filtering and exponential enhancement.
Further, this method builds on earlier reported SSIM-based automated choroid localization method [26] to accurately confine the analysis only to the choroid region. In
the subsequent sections, the methodology and experimental results of Vupparaboina
et al.’s method, here after referred as exponentiation-based method, are discussed in
detail.