

9 Choroidal OCT Analytics
235
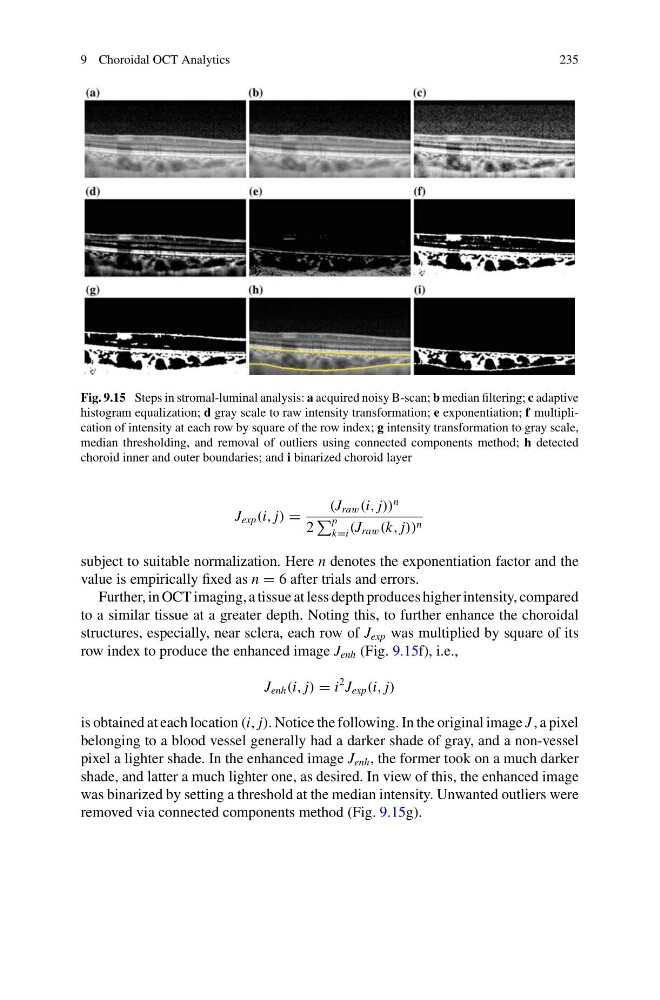
Fig. 9.15 Steps in stromal-luminal analysis: a acquired noisy B-scan; b median filtering; c adaptive
histogram equalization; d gray scale to raw intensity transformation; e exponentiation; f multiplication of intensity at each row by square of the row index; g intensity transformation to gray scale,
median thresholding, and removal of outliers using connected components method; h detected
choroid inner and outer boundaries; and i binarized choroid layer
J exp (i, j) =
(J raw (i, j))
n
2
p
k=i (J raw (k, j)) n
subject to suitable normalization. Here n denotes the exponentiation factor and the
value is empirically fixed as n = 6 after trials and errors.
Further, in OCT imaging, a tissue at less depth produces higher intensity, compared
to a similar tissue at a greater depth. Noting this, to further enhance the choroidal
structures, especially, near sclera, each row of J exp was multiplied by square of its
row index to produce the enhanced image J enh (Fig. 9.15f), i.e.,
J enh (i, j) = i
2 J exp (i, j)
is obtained at each location (i, j). Notice the following. In the original image J , a pixel
belonging to a blood vessel generally had a darker shade of gray, and a non-vessel
pixel a lighter shade. In the enhanced image J enh , the former took on a much darker
shade, and latter a much lighter one, as desired. In view of this, the enhanced image
was binarized by setting a threshold at the median intensity. Unwanted outliers were
removed via connected components method (Fig. 9.15g).
235
Fig. 9.15 Steps in stromal-luminal analysis: a acquired noisy B-scan; b median filtering; c adaptive
histogram equalization; d gray scale to raw intensity transformation; e exponentiation; f multiplication of intensity at each row by square of the row index; g intensity transformation to gray scale,
median thresholding, and removal of outliers using connected components method; h detected
choroid inner and outer boundaries; and i binarized choroid layer
J exp (i, j) =
(J raw (i, j))
n
2
p
k=i (J raw (k, j)) n
subject to suitable normalization. Here n denotes the exponentiation factor and the
value is empirically fixed as n = 6 after trials and errors.
Further, in OCT imaging, a tissue at less depth produces higher intensity, compared
to a similar tissue at a greater depth. Noting this, to further enhance the choroidal
structures, especially, near sclera, each row of J exp was multiplied by square of its
row index to produce the enhanced image J enh (Fig. 9.15f), i.e.,
J enh (i, j) = i
2 J exp (i, j)
is obtained at each location (i, j). Notice the following. In the original image J , a pixel
belonging to a blood vessel generally had a darker shade of gray, and a non-vessel
pixel a lighter shade. In the enhanced image J enh , the former took on a much darker
shade, and latter a much lighter one, as desired. In view of this, the enhanced image
was binarized by setting a threshold at the median intensity. Unwanted outliers were
removed via connected components method (Fig. 9.15g).