

230
K. K. Vupparaboina et al.
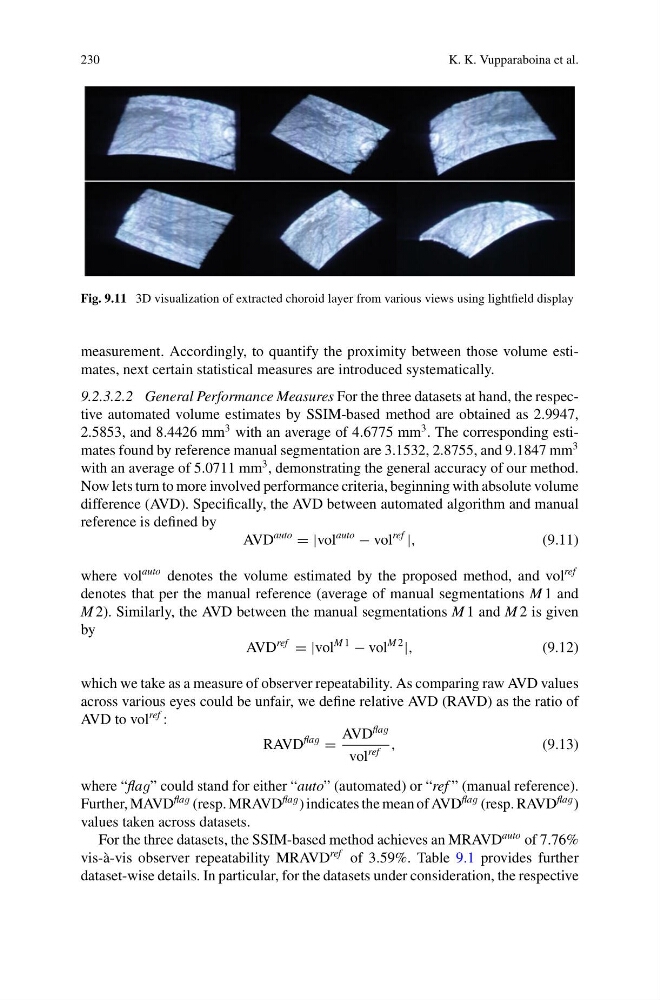
Fig. 9.11 3D visualization of extracted choroid layer from various views using lightfield display
measurement. Accordingly, to quantify the proximity between those volume estimates, next certain statistical measures are introduced systematically.
9.2.3.2.2 General Performance Measures For the three datasets at hand, the respective automated volume estimates by SSIM-based method are obtained as 2.9947,
2.5853, and 8.4426 mm
3 with an average of 4.6775 mm
3 . The corresponding estimates found by reference manual segmentation are 3.1532, 2.8755, and 9.1847 mm
3
with an average of 5.0711 mm
3 , demonstrating the general accuracy of our method.
Now lets turn to more involved performance criteria, beginning with absolute volume
difference (AVD). Specifically, the AVD between automated algorithm and manual
reference is defined by
AVD
auto
= |vol
auto
− vol
ref
|,
(9.11)
where vol
auto denotes the volume estimated by the proposed method, and vol
ref
denotes that per the manual reference (average of manual segmentations M 1 and
M 2). Similarly, the AVD between the manual segmentations M 1 and M 2 is given
by
AVD
ref
= |vol
M 1
− vol
M 2
|,
(9.12)
which we take as a measure of observer repeatability. As comparing raw AVD values
across various eyes could be unfair, we define relative AVD (RAVD) as the ratio of
AVD to vol
ref :
RAVD
flag
=
AVD
flag
vol
ref
,
(9.13)
where “flag” could stand for either “auto” (automated) or “ref ” (manual reference).
Further, MAVD
flag (resp. MRAVD
flag ) indicates the mean of AVD
flag (resp. RAVD
flag )
values taken across datasets.
For the three datasets, the SSIM-based method achieves an MRAVD
auto of 7.76%
vis-à-vis observer repeatability MRAVD
ref of 3.59%. Table 9.1 provides further
dataset-wise details. In particular, for the datasets under consideration, the respective
K. K. Vupparaboina et al.
Fig. 9.11 3D visualization of extracted choroid layer from various views using lightfield display
measurement. Accordingly, to quantify the proximity between those volume estimates, next certain statistical measures are introduced systematically.
9.2.3.2.2 General Performance Measures For the three datasets at hand, the respective automated volume estimates by SSIM-based method are obtained as 2.9947,
2.5853, and 8.4426 mm
3 with an average of 4.6775 mm
3 . The corresponding estimates found by reference manual segmentation are 3.1532, 2.8755, and 9.1847 mm
3
with an average of 5.0711 mm
3 , demonstrating the general accuracy of our method.
Now lets turn to more involved performance criteria, beginning with absolute volume
difference (AVD). Specifically, the AVD between automated algorithm and manual
reference is defined by
AVD
auto
= |vol
auto
− vol
ref
|,
(9.11)
where vol
auto denotes the volume estimated by the proposed method, and vol
ref
denotes that per the manual reference (average of manual segmentations M 1 and
M 2). Similarly, the AVD between the manual segmentations M 1 and M 2 is given
by
AVD
ref
= |vol
M 1
− vol
M 2
|,
(9.12)
which we take as a measure of observer repeatability. As comparing raw AVD values
across various eyes could be unfair, we define relative AVD (RAVD) as the ratio of
AVD to vol
ref :
RAVD
flag
=
AVD
flag
vol
ref
,
(9.13)
where “flag” could stand for either “auto” (automated) or “ref ” (manual reference).
Further, MAVD
flag (resp. MRAVD
flag ) indicates the mean of AVD
flag (resp. RAVD
flag )
values taken across datasets.
For the three datasets, the SSIM-based method achieves an MRAVD
auto of 7.76%
vis-à-vis observer repeatability MRAVD
ref of 3.59%. Table 9.1 provides further
dataset-wise details. In particular, for the datasets under consideration, the respective