

9 Choroidal OCT Analytics
231
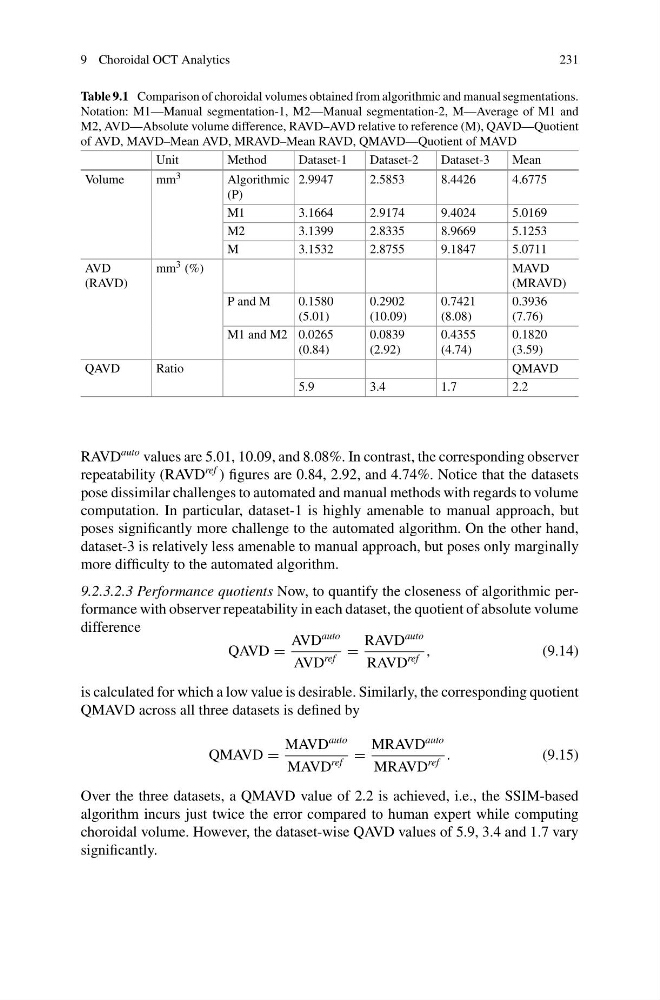
Table 9.1 Comparison of choroidal volumes obtained from algorithmic and manual segmentations.
Notation: M1—Manual segmentation-1, M2—Manual segmentation-2, M—Average of M1 and
M2, AVD—Absolute volume difference, RAVD–AVD relative to reference (M), QAVD—Quotient
of AVD, MAVD–Mean AVD, MRAVD–Mean RAVD, QMAVD—Quotient of MAVD
Unit
Method
Dataset-1
Dataset-2
Dataset-3
Mean
Volume
mm 3
Algorithmic
(P)
2.9947
2.5853
8.4426
4.6775
M1
3.1664
2.9174
9.4024
5.0169
M2
3.1399
2.8335
8.9669
5.1253
M
3.1532
2.8755
9.1847
5.0711
AVD
(RAVD)
mm 3 (%)
MAVD
(MRAVD)
P and M
0.1580
(5.01)
0.2902
(10.09)
0.7421
(8.08)
0.3936
(7.76)
M1 and M2 0.0265
(0.84)
0.0839
(2.92)
0.4355
(4.74)
0.1820
(3.59)
QAVD
Ratio
QMAVD
5.9
3.4
1.7
2.2
RAVD
auto values are 5.01, 10.09, and 8.08%. In contrast, the corresponding observer
repeatability (RAVD
ref ) figures are 0.84, 2.92, and 4.74%. Notice that the datasets
pose dissimilar challenges to automated and manual methods with regards to volume
computation. In particular, dataset-1 is highly amenable to manual approach, but
poses significantly more challenge to the automated algorithm. On the other hand,
dataset-3 is relatively less amenable to manual approach, but poses only marginally
more difficulty to the automated algorithm.
9.2.3.2.3 Performance quotients Now, to quantify the closeness of algorithmic performance with observer repeatability in each dataset, the quotient of absolute volume
difference
QAVD =
AVD
auto
AVD
ref
=
RAVD
auto
RAVD
ref
,
(9.14)
is calculated for which a low value is desirable. Similarly, the corresponding quotient
QMAVD across all three datasets is defined by
QMAVD =
MAVD
auto
MAVD
ref
=
MRAVD
auto
MRAVD
ref
.
(9.15)
Over the three datasets, a QMAVD value of 2.2 is achieved, i.e., the SSIM-based
algorithm incurs just twice the error compared to human expert while computing
choroidal volume. However, the dataset-wise QAVD values of 5.9, 3.4 and 1.7 vary
significantly.
231
Table 9.1 Comparison of choroidal volumes obtained from algorithmic and manual segmentations.
Notation: M1—Manual segmentation-1, M2—Manual segmentation-2, M—Average of M1 and
M2, AVD—Absolute volume difference, RAVD–AVD relative to reference (M), QAVD—Quotient
of AVD, MAVD–Mean AVD, MRAVD–Mean RAVD, QMAVD—Quotient of MAVD
Unit
Method
Dataset-1
Dataset-2
Dataset-3
Mean
Volume
mm 3
Algorithmic
(P)
2.9947
2.5853
8.4426
4.6775
M1
3.1664
2.9174
9.4024
5.0169
M2
3.1399
2.8335
8.9669
5.1253
M
3.1532
2.8755
9.1847
5.0711
AVD
(RAVD)
mm 3 (%)
MAVD
(MRAVD)
P and M
0.1580
(5.01)
0.2902
(10.09)
0.7421
(8.08)
0.3936
(7.76)
M1 and M2 0.0265
(0.84)
0.0839
(2.92)
0.4355
(4.74)
0.1820
(3.59)
QAVD
Ratio
QMAVD
5.9
3.4
1.7
2.2
RAVD
auto values are 5.01, 10.09, and 8.08%. In contrast, the corresponding observer
repeatability (RAVD
ref ) figures are 0.84, 2.92, and 4.74%. Notice that the datasets
pose dissimilar challenges to automated and manual methods with regards to volume
computation. In particular, dataset-1 is highly amenable to manual approach, but
poses significantly more challenge to the automated algorithm. On the other hand,
dataset-3 is relatively less amenable to manual approach, but poses only marginally
more difficulty to the automated algorithm.
9.2.3.2.3 Performance quotients Now, to quantify the closeness of algorithmic performance with observer repeatability in each dataset, the quotient of absolute volume
difference
QAVD =
AVD
auto
AVD
ref
=
RAVD
auto
RAVD
ref
,
(9.14)
is calculated for which a low value is desirable. Similarly, the corresponding quotient
QMAVD across all three datasets is defined by
QMAVD =
MAVD
auto
MAVD
ref
=
MRAVD
auto
MRAVD
ref
.
(9.15)
Over the three datasets, a QMAVD value of 2.2 is achieved, i.e., the SSIM-based
algorithm incurs just twice the error compared to human expert while computing
choroidal volume. However, the dataset-wise QAVD values of 5.9, 3.4 and 1.7 vary
significantly.