

9 Choroidal OCT Analytics
219
9.2.3 Results and Statistical Analysis
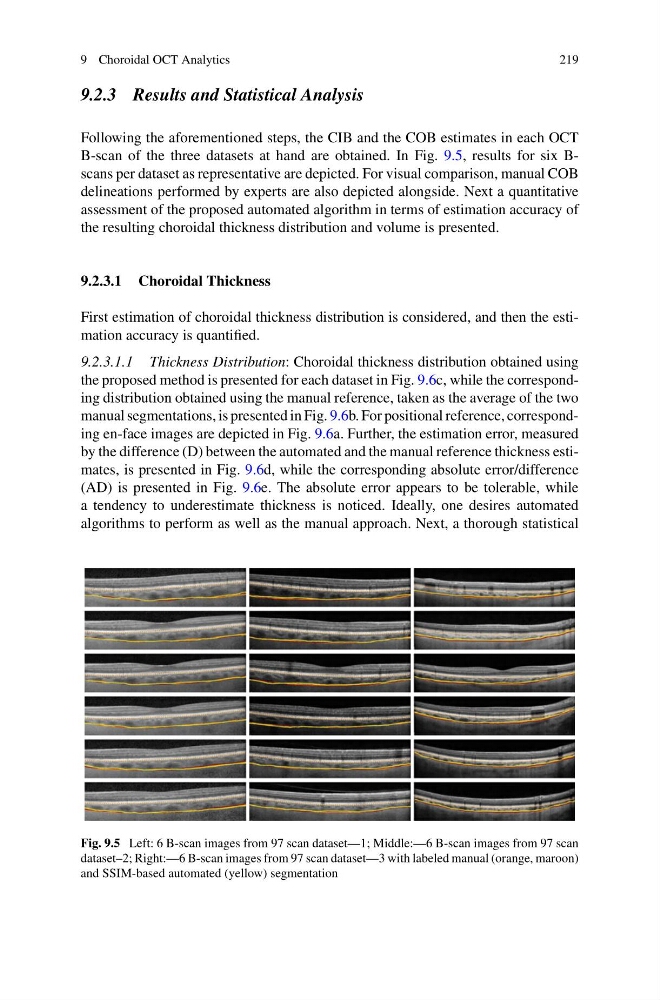
Following the aforementioned steps, the CIB and the COB estimates in each OCT
B-scan of the three datasets at hand are obtained. In Fig. 9.5, results for six Bscans per dataset as representative are depicted. For visual comparison, manual COB
delineations performed by experts are also depicted alongside. Next a quantitative
assessment of the proposed automated algorithm in terms of estimation accuracy of
the resulting choroidal thickness distribution and volume is presented.
9.2.3.1 Choroidal Thickness
First estimation of choroidal thickness distribution is considered, and then the estimation accuracy is quantified.
9.2.3.1.1 Thickness Distribution: Choroidal thickness distribution obtained using
the proposed method is presented for each dataset in Fig. 9.6c, while the corresponding distribution obtained using the manual reference, taken as the average of the two
manual segmentations, is presented in Fig. 9.6b. For positional reference, corresponding en-face images are depicted in Fig. 9.6a. Further, the estimation error, measured
by the difference (D) between the automated and the manual reference thickness estimates, is presented in Fig. 9.6d, while the corresponding absolute error/difference
(AD) is presented in Fig. 9.6e. The absolute error appears to be tolerable, while
a tendency to underestimate thickness is noticed. Ideally, one desires automated
algorithms to perform as well as the manual approach. Next, a thorough statistical
Fig. 9.5 Left: 6 B-scan images from 97 scan dataset—1; Middle:—6 B-scan images from 97 scan
dataset–2; Right:—6 B-scan images from 97 scan dataset—3 with labeled manual (orange, maroon)
and SSIM-based automated (yellow) segmentation
219
9.2.3 Results and Statistical Analysis
Following the aforementioned steps, the CIB and the COB estimates in each OCT
B-scan of the three datasets at hand are obtained. In Fig. 9.5, results for six Bscans per dataset as representative are depicted. For visual comparison, manual COB
delineations performed by experts are also depicted alongside. Next a quantitative
assessment of the proposed automated algorithm in terms of estimation accuracy of
the resulting choroidal thickness distribution and volume is presented.
9.2.3.1 Choroidal Thickness
First estimation of choroidal thickness distribution is considered, and then the estimation accuracy is quantified.
9.2.3.1.1 Thickness Distribution: Choroidal thickness distribution obtained using
the proposed method is presented for each dataset in Fig. 9.6c, while the corresponding distribution obtained using the manual reference, taken as the average of the two
manual segmentations, is presented in Fig. 9.6b. For positional reference, corresponding en-face images are depicted in Fig. 9.6a. Further, the estimation error, measured
by the difference (D) between the automated and the manual reference thickness estimates, is presented in Fig. 9.6d, while the corresponding absolute error/difference
(AD) is presented in Fig. 9.6e. The absolute error appears to be tolerable, while
a tendency to underestimate thickness is noticed. Ideally, one desires automated
algorithms to perform as well as the manual approach. Next, a thorough statistical
Fig. 9.5 Left: 6 B-scan images from 97 scan dataset—1; Middle:—6 B-scan images from 97 scan
dataset–2; Right:—6 B-scan images from 97 scan dataset—3 with labeled manual (orange, maroon)
and SSIM-based automated (yellow) segmentation