

220
K. K. Vupparaboina et al.
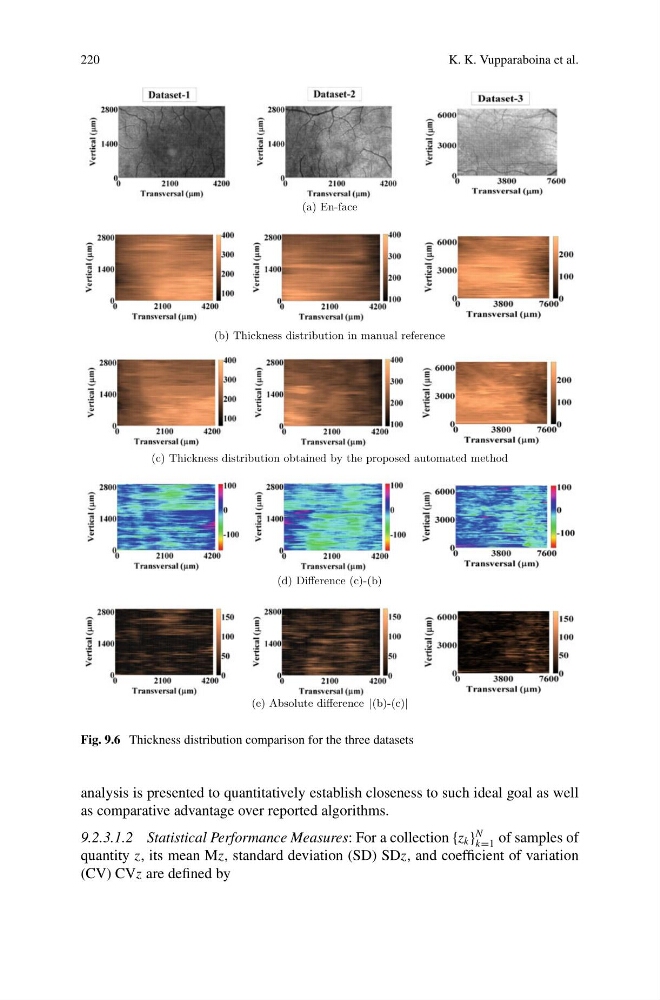
(a) En-face
(b) Thickness distribution in manual reference
(c) Thickness distribution obtained by the proposed automated method
(d) Difference (c)-(b)
(e) Absolute difference |(b)-(c)|
Fig. 9.6 Thickness distribution comparison for the three datasets
analysis is presented to quantitatively establish closeness to such ideal goal as well
as comparative advantage over reported algorithms.
9.2.3.1.2 Statistical Performance Measures: For a collection {z k }
N
k=1 of samples of
quantity z, its mean Mz, standard deviation (SD) SDz, and coefficient of variation
(CV) CVz are defined by
K. K. Vupparaboina et al.
(a) En-face
(b) Thickness distribution in manual reference
(c) Thickness distribution obtained by the proposed automated method
(d) Difference (c)-(b)
(e) Absolute difference |(b)-(c)|
Fig. 9.6 Thickness distribution comparison for the three datasets
analysis is presented to quantitatively establish closeness to such ideal goal as well
as comparative advantage over reported algorithms.
9.2.3.1.2 Statistical Performance Measures: For a collection {z k }
N
k=1 of samples of
quantity z, its mean Mz, standard deviation (SD) SDz, and coefficient of variation
(CV) CVz are defined by