

8 Segmentation of Optic Disc and Cup-to-Disc Ratio Quantification …
203
mentation. The optic disc margin segmented by coarse disc margin location seems
consistently larger than by the manual segmentation since it applies convex hull fitting to preserve the largest margin for the patch searching procedure. The disc and cup
margins segmented by the patch searching-based method are smoother than by the
A-scan classification-based segmentation because it considers the spatial correlation
smoothness constraint, rather than by directly classifying each A-scan independently.
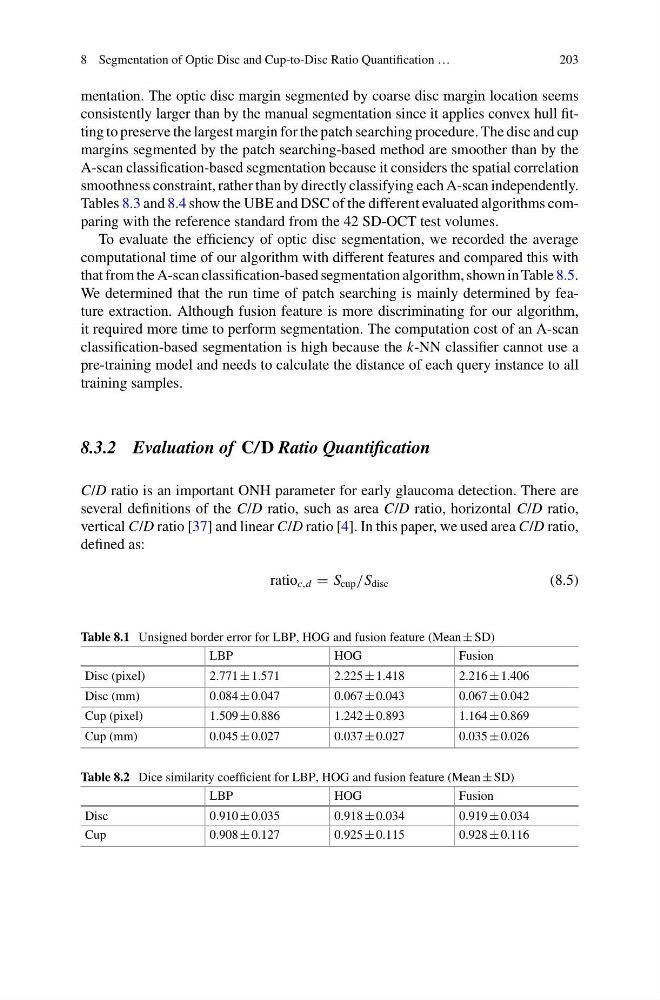
Tables 8.3 and 8.4 show the UBE and DSC of the different evaluated algorithms comparing with the reference standard from the 42 SD-OCT test volumes.
To evaluate the efficiency of optic disc segmentation, we recorded the average
computational time of our algorithm with different features and compared this with
that from the A-scan classification-based segmentation algorithm, shown in Table 8.5.
We determined that the run time of patch searching is mainly determined by feature extraction. Although fusion feature is more discriminating for our algorithm,
it required more time to perform segmentation. The computation cost of an A-scan
classification-based segmentation is high because the k-NN classifier cannot use a
pre-training model and needs to calculate the distance of each query instance to all
training samples.
8.3.2 Evaluation of C/D Ratio Quantification
C/D ratio is an important ONH parameter for early glaucoma detection. There are
several definitions of the C/D ratio, such as area C/D ratio, horizontal C/D ratio,
vertical C/D ratio [37] and linear C/D ratio [4]. In this paper, we used area C/D ratio,
defined as:
ratio c,d S cup /S disc
(8.5)
Table 8.1 Unsigned border error for LBP, HOG and fusion feature (Mean ± SD)
LBP
HOG
Fusion
Disc (pixel)
2.771 ± 1.571
2.225 ± 1.418
2.216 ± 1.406
Disc (mm)
0.084 ± 0.047
0.067 ± 0.043
0.067 ± 0.042
Cup (pixel)
1.509 ± 0.886
1.242 ± 0.893
1.164 ± 0.869
Cup (mm)
0.045 ± 0.027
0.037 ± 0.027
0.035 ± 0.026
Table 8.2 Dice similarity coefficient for LBP, HOG and fusion feature (Mean ± SD)
LBP
HOG
Fusion
Disc
0.910 ± 0.035
0.918 ± 0.034
0.919 ± 0.034
Cup
0.908 ± 0.127
0.925 ± 0.115
0.928 ± 0.116
203
mentation. The optic disc margin segmented by coarse disc margin location seems
consistently larger than by the manual segmentation since it applies convex hull fitting to preserve the largest margin for the patch searching procedure. The disc and cup
margins segmented by the patch searching-based method are smoother than by the
A-scan classification-based segmentation because it considers the spatial correlation
smoothness constraint, rather than by directly classifying each A-scan independently.
Tables 8.3 and 8.4 show the UBE and DSC of the different evaluated algorithms comparing with the reference standard from the 42 SD-OCT test volumes.
To evaluate the efficiency of optic disc segmentation, we recorded the average
computational time of our algorithm with different features and compared this with
that from the A-scan classification-based segmentation algorithm, shown in Table 8.5.
We determined that the run time of patch searching is mainly determined by feature extraction. Although fusion feature is more discriminating for our algorithm,
it required more time to perform segmentation. The computation cost of an A-scan
classification-based segmentation is high because the k-NN classifier cannot use a
pre-training model and needs to calculate the distance of each query instance to all
training samples.
8.3.2 Evaluation of C/D Ratio Quantification
C/D ratio is an important ONH parameter for early glaucoma detection. There are
several definitions of the C/D ratio, such as area C/D ratio, horizontal C/D ratio,
vertical C/D ratio [37] and linear C/D ratio [4]. In this paper, we used area C/D ratio,
defined as:
ratio c,d S cup /S disc
(8.5)
Table 8.1 Unsigned border error for LBP, HOG and fusion feature (Mean ± SD)
LBP
HOG
Fusion
Disc (pixel)
2.771 ± 1.571
2.225 ± 1.418
2.216 ± 1.406
Disc (mm)
0.084 ± 0.047
0.067 ± 0.043
0.067 ± 0.042
Cup (pixel)
1.509 ± 0.886
1.242 ± 0.893
1.164 ± 0.869
Cup (mm)
0.045 ± 0.027
0.037 ± 0.027
0.035 ± 0.026
Table 8.2 Dice similarity coefficient for LBP, HOG and fusion feature (Mean ± SD)
LBP
HOG
Fusion
Disc
0.910 ± 0.035
0.918 ± 0.034
0.919 ± 0.034
Cup
0.908 ± 0.127
0.925 ± 0.115
0.928 ± 0.116